I left the Wasatch Mountains with Gambel oak still bare and reached the redwoods 48 hours later standing under trees that haven’t seen a dry summer in a thousand years.
That is not a figure of speech. In three days and 1,200 miles, I drove from a landscape where nothing grows (the Bonneville Salt Flats, five inches of annual rainfall, zero plants) to a landscape where everything grows at once (the Humboldt redwood coast, 60 inches of rain plus 30 percent more from fog, 250-foot trees stacked five canopy layers deep). Between those endpoints, I crossed a Mediterranean oak savanna, a mixed conifer forest at 6,000 feet, and the transition zone where Sierra Nevada pine forest meets the fog belt. Each one looked completely different from the last. Each one changed how I see the one I live in.
Something has been happening to me since I started rebuilding this website. I pay attention now. Not in the vague “I appreciate nature” sense, but in the way where I pull over because the bark on a ponderosa looks different from the bark on a Douglas-fir and I need to know why. Building a knowledge base about plants and their problems has rewired how I look at everything, and this road trip was the first time I realized how deep that change goes. I kept stopping. I kept noticing things I would have driven past two years ago. And I kept connecting what I saw to what I know from home.
Every observation I made on this drive applies in a Puget Sound garden. You do not need to drive 1,200 miles to use them. But it helps to see the extremes before you can read the middle, and it helps to hear how someone else is learning to look.
The Wasatch Front: Phenology as Climate Fingerprint
The trip started in the mountains east of Salt Lake City on May 4. I had been in Utah for a family event and was taking the long way home. The Wasatch front in early May is a study in phenological contrast: two species on the same hillside, weeks apart in their spring development.
Box elder (Acer negundo) was in full spring leaf. Compound leaves unfurled, bright green, catching every angle of morning light. Ten feet upslope, Gambel oak (Quercus gambelii) was barely pushing. Buds swelling, a few leaves just cracking open, but the canopy still mostly bare branches against the sky.
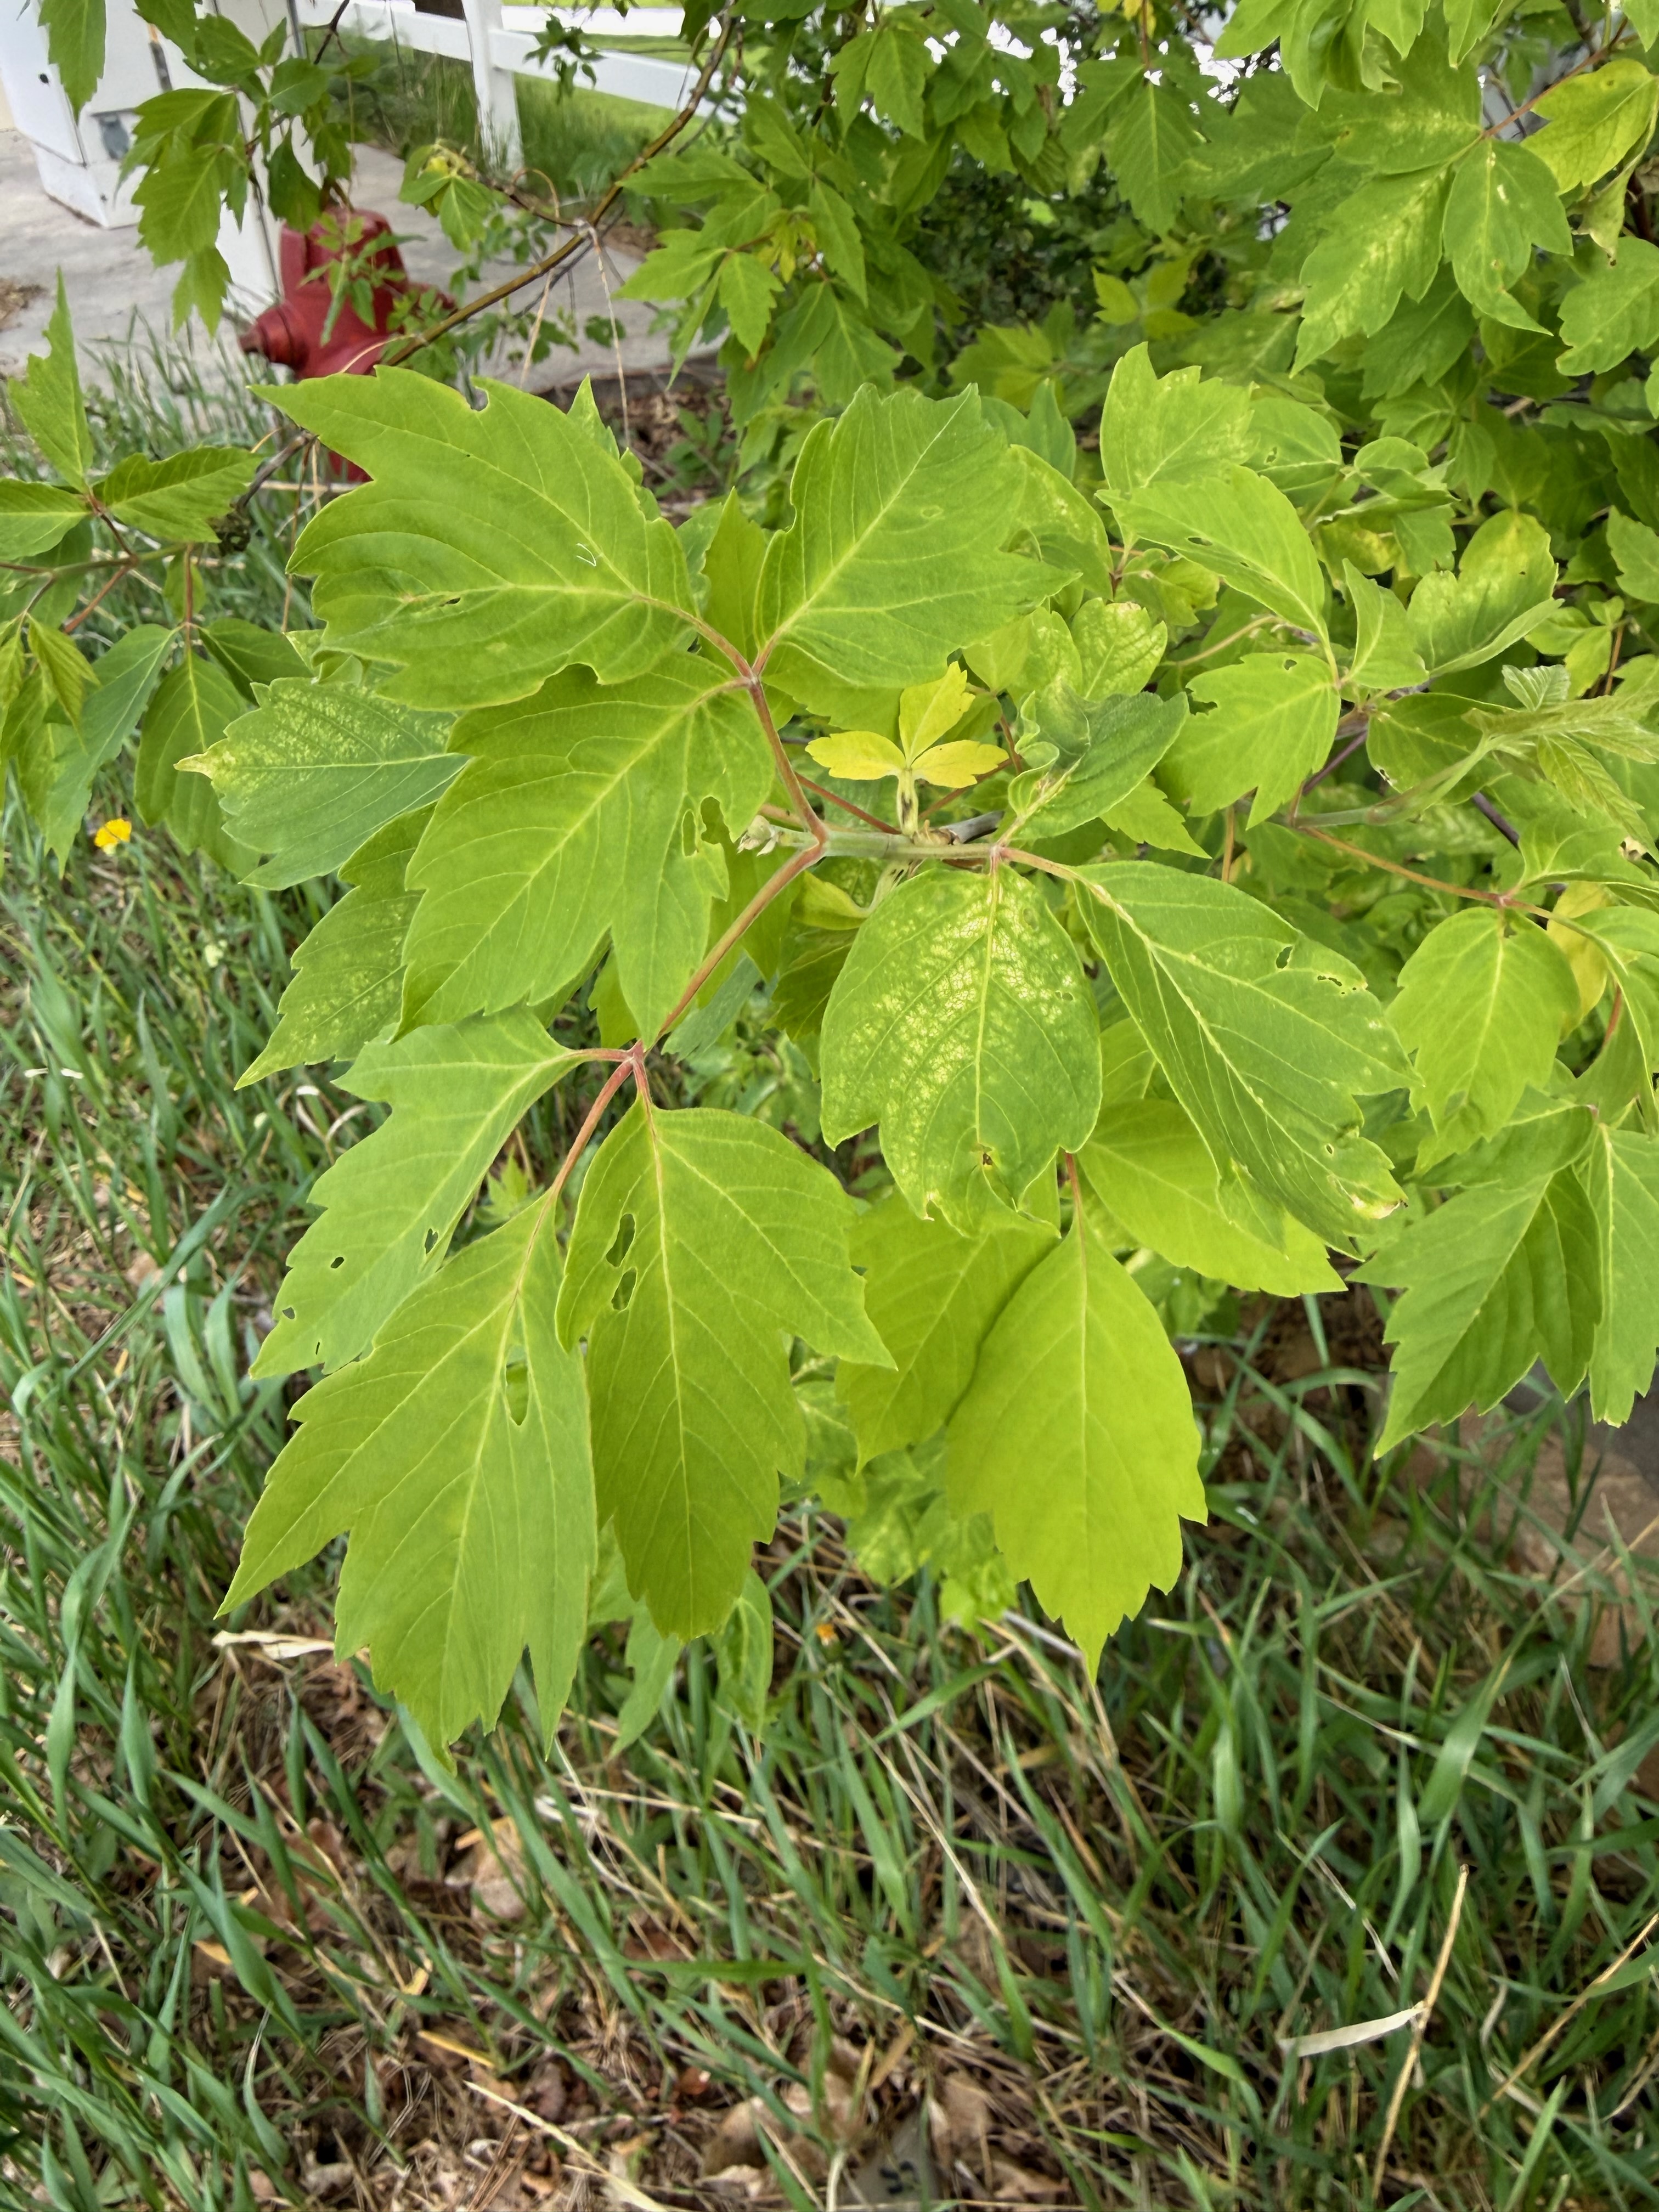 Box elder in full spring leaf while Gambel oak on the same hillside is barely leafing out. Two species, one canyon, weeks apart.
That gap is a climate fingerprint. Continental climates deliver spring as a temperature pulse: warm days arrive suddenly between late freezes, and each species responds at its own threshold. Box elder breaks dormancy earlier; Gambel oak waits. The result is a hillside where you can read the species like a thermometer, each one marking where it sits on the spring temperature curve.
Compare that to what you see at home. Maritime buffering spreads our spring across a longer, cooler ramp. Leaf-out in the Puget Sound lowlands happens over weeks, not days, and the contrast between early and late species is gentler. You rarely see two trees on the same site separated by a month of phenology the way you do in the Wasatch. But the mechanism is identical. Your magnolia blooms before your dogwood. Your bigleaf maple leafs out before your vine maple. The gap between them is your climate talking.
The Wasatch hillside taught me one more thing. South-facing slopes were green; north-facing slopes were bare. Aspect creates microclimates visible at a glance, and your yard has the same physics. The south side of your house runs warmer and drier than the north side. The difference might be two weeks of bloom timing and an entirely different set of plants that thrive there.
Observation skill: Look at two species side by side. When one is weeks ahead of the other, you are reading the climate’s thermostat.
Bonneville Salt Flats: Ground Zero
I have driven past the Bonneville Salt Flats sign on I-80 a dozen times in my life and never stopped. This time I pulled off and walked out onto the salt.
Nothing prepared me for the silence. No insects, no birds, no rustle of wind through foliage, because there is no foliage. The polygonal salt crust extends to the horizon in every direction, white and flat and absolute. Distant mountain ranges rim the basin like the edge of a bowl. The sky is the deepest blue you will see in the continental United States because the air holds almost no moisture.
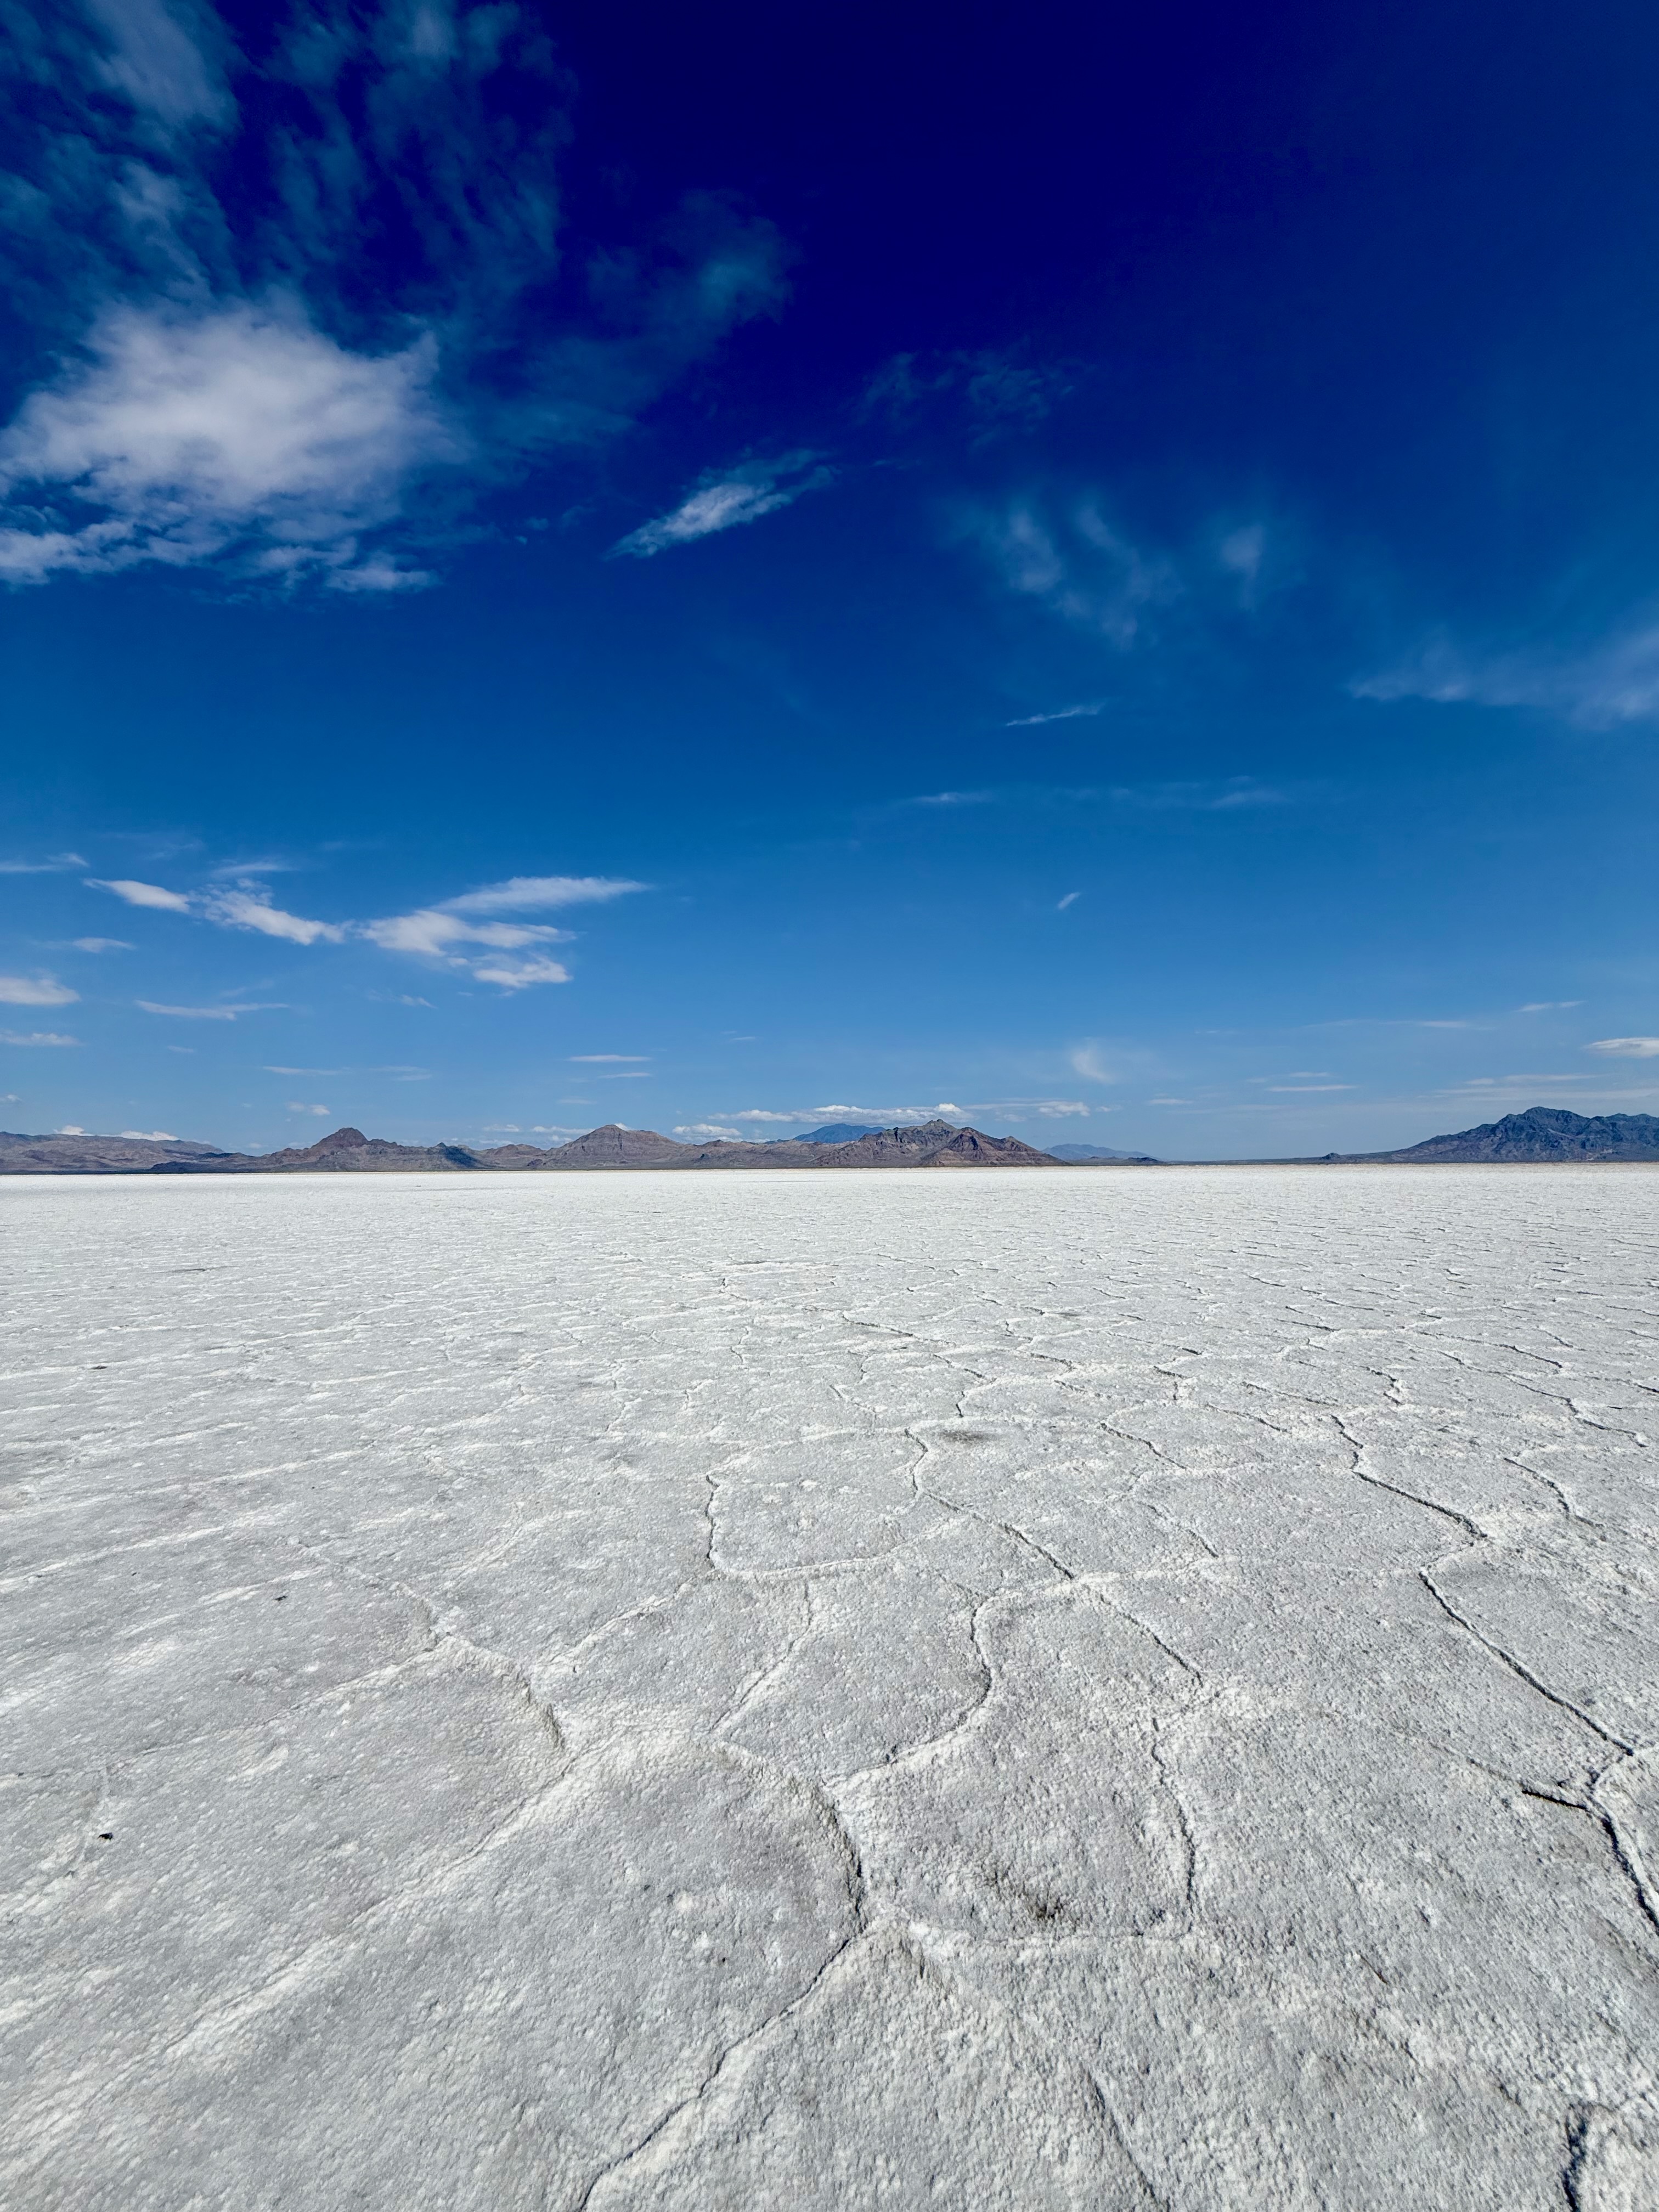 Bonneville Salt Flats. Five inches of annual precipitation. Zero vegetation. This is the opposite end of the spectrum from the redwoods, 800 miles west.
Most gardeners have never seen a landscape with literally zero plant life. Not sparse vegetation, not drought-stressed vegetation. Zero. This is what “no moisture” actually looks like: a 40-square-mile remnant of ancient Lake Bonneville, evaporated 13,000 years ago, leaving behind a salt crust up to five feet thick. What little rain falls here evaporates or concentrates salts further. Nothing macroscopic grows.
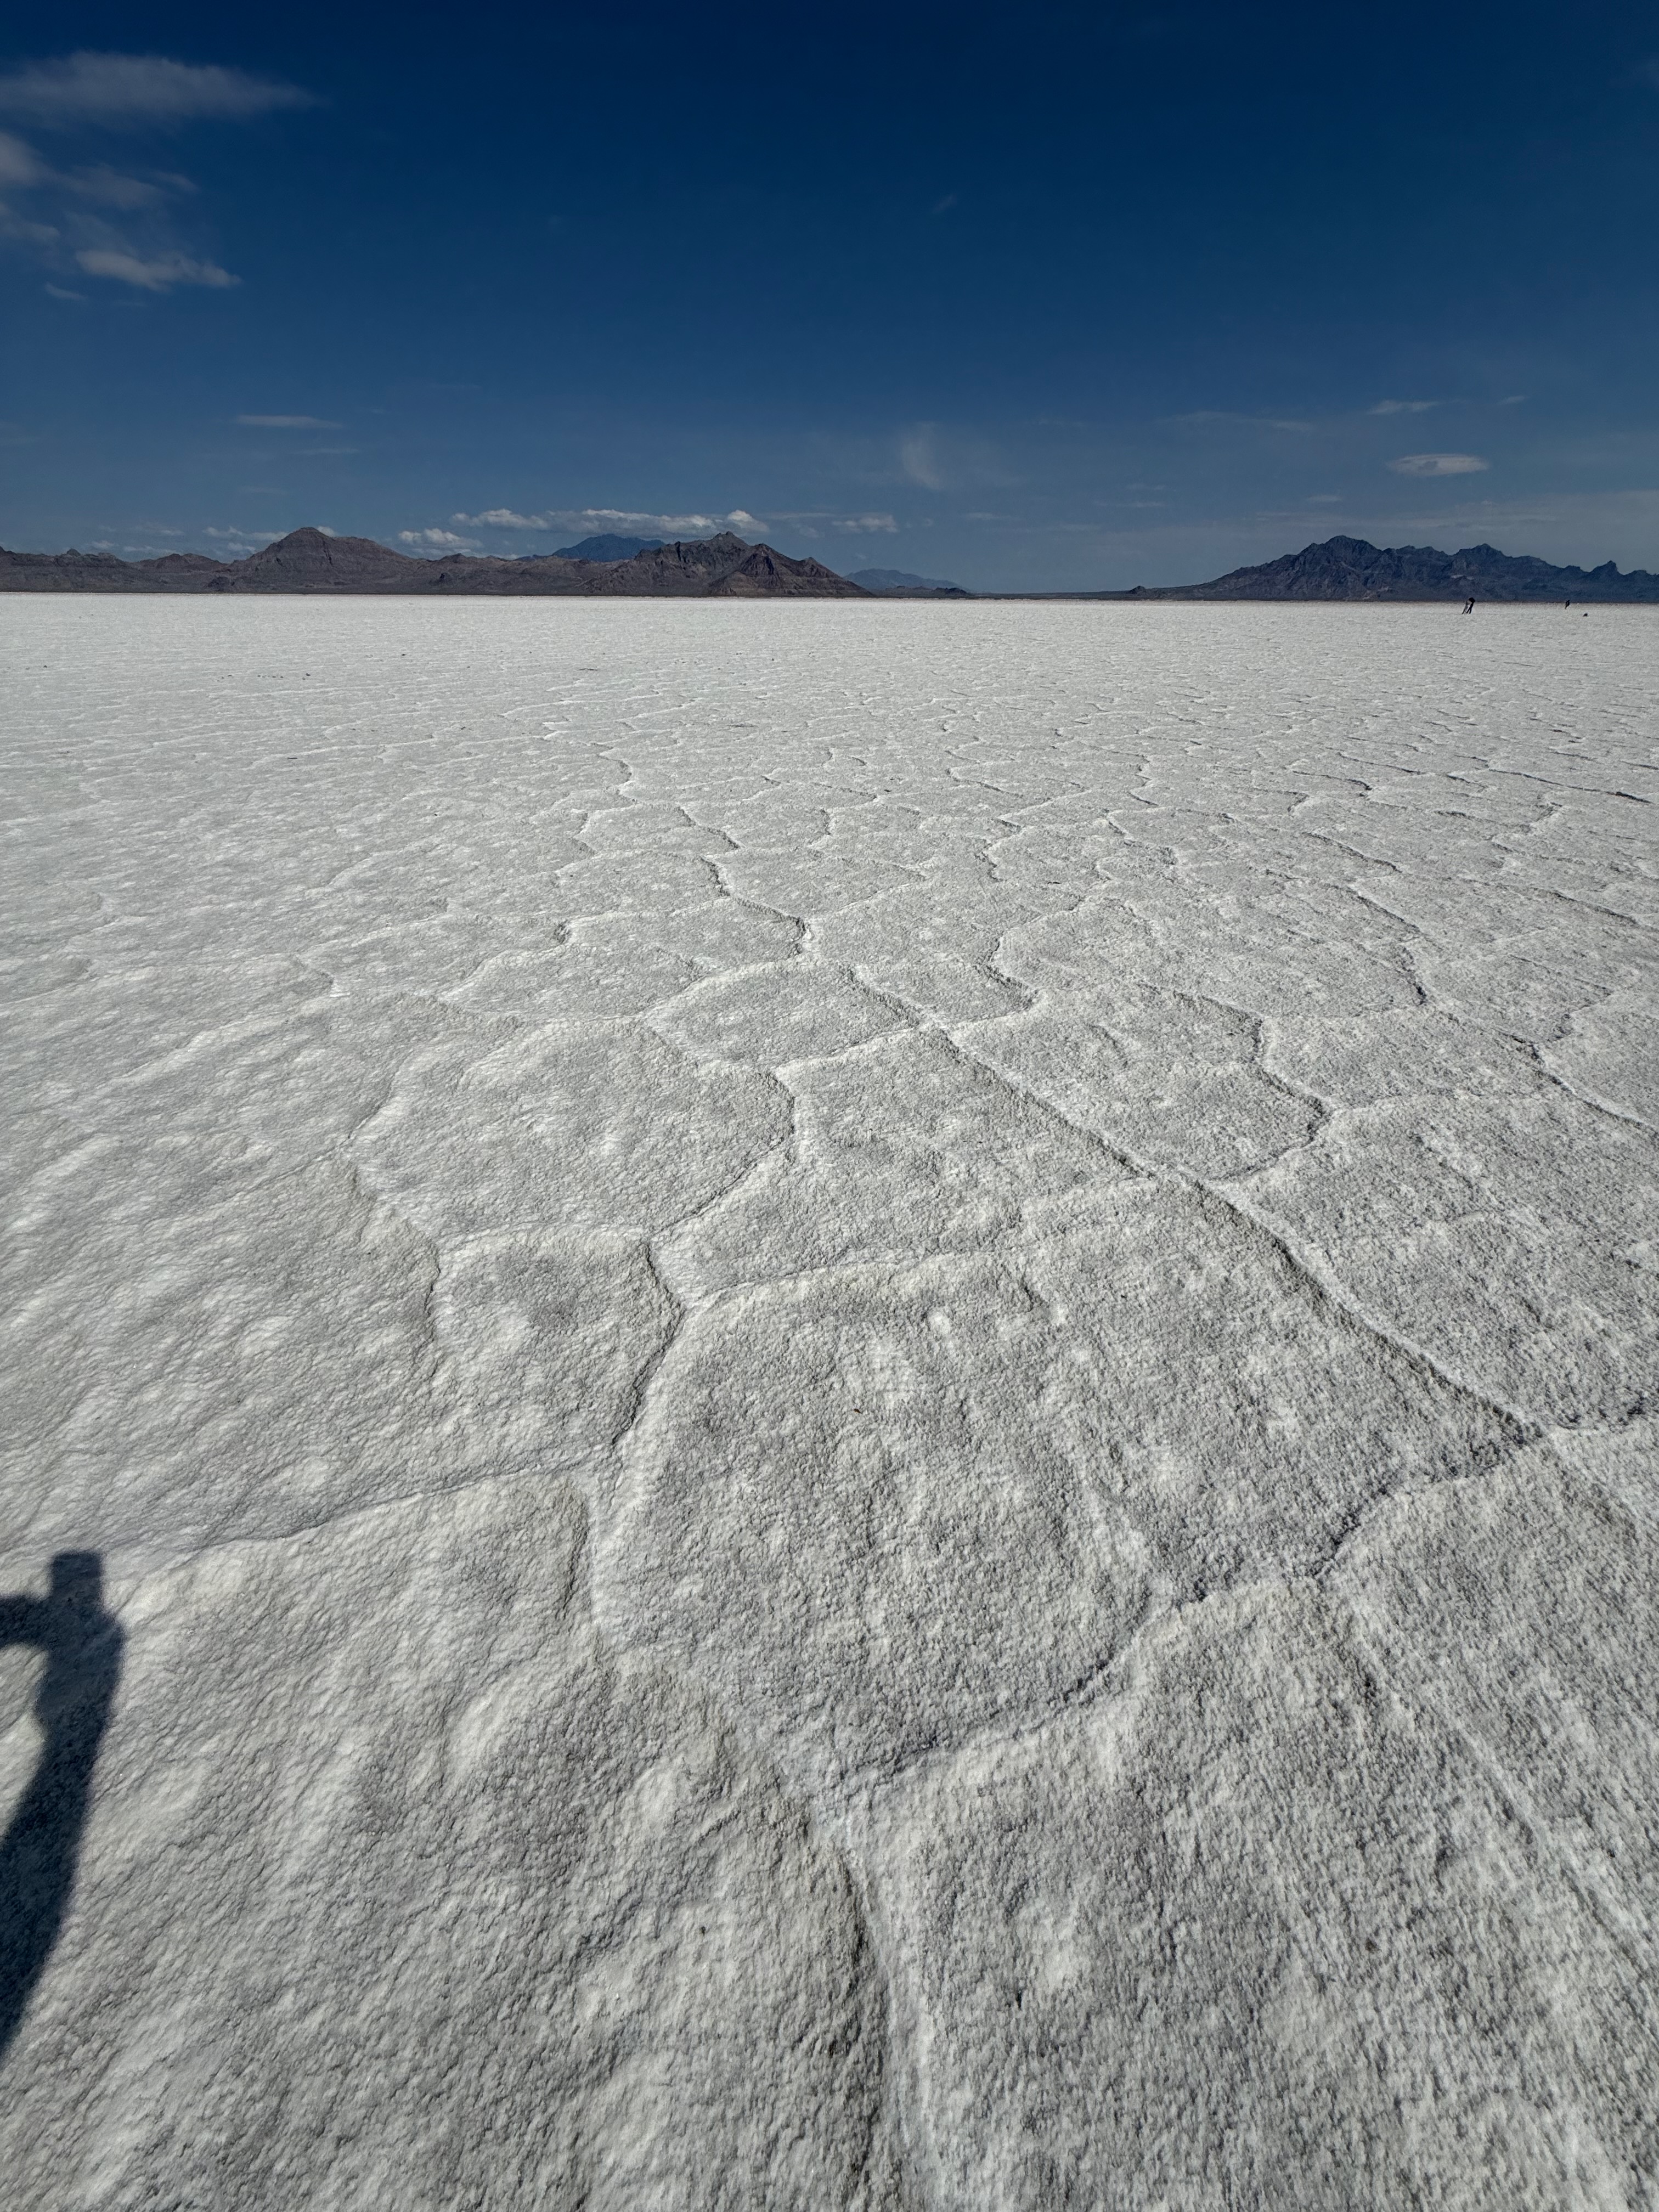 Polygon patterns in the salt crust. The landscape expressing its aridity the way a dried puddle expresses drought.
The polygon patterns in the crust are worth a closer look. As the surface heats and cools, the salt expands and contracts, forming hexagonal ridges. It is the landscape writing its own climate data in geometry. You see a scaled-down version of this every summer when clay soil cracks in a garden bed that dried out. The mechanism is related: material contracting as it loses moisture, expressing that loss as surface pattern. When you see cracking in your garden soil, you are reading the same signal.
The teaching point from Bonneville is simple: when you see nothing growing, ask why. The answer is always in the soil or the water, usually both. You deal with a milder version of this every day. Clay soils with poor drainage. High pH pockets where the builder dumped concrete washout. Salt spray in coastal neighborhoods. The salt flats are the extreme case. Your garden has the same chemistry at a different scale.
Observation skill: When nothing grows, the answer is in the soil or the water. Start there.
Sierra Nevada: Elevation as Climate Machine
The next morning I left Reno and climbed Donner Pass into the Sierra Nevada. Within an hour I went from sagebrush steppe at 4,500 feet to snowcapped peaks above timberline, and then dropped into a mixed conifer forest at around 5,500 feet that felt like a completely different planet from the salt flats I had left the day before.
The Sierra mixed conifer zone is one of the most species-rich forest types in North America. A USFS interpretive sign at the Omega Overlook named five conifers growing within view: ponderosa pine (Pinus ponderosa), sugar pine (Pinus lambertiana), incense cedar (Calocedrus decurrens), Douglas-fir (Pseudotsuga menziesii), and white fir (Abies concolor). Five large conifers, each occupying a slightly different niche on the same mountainside. That interpretive sign was a teaching gift.
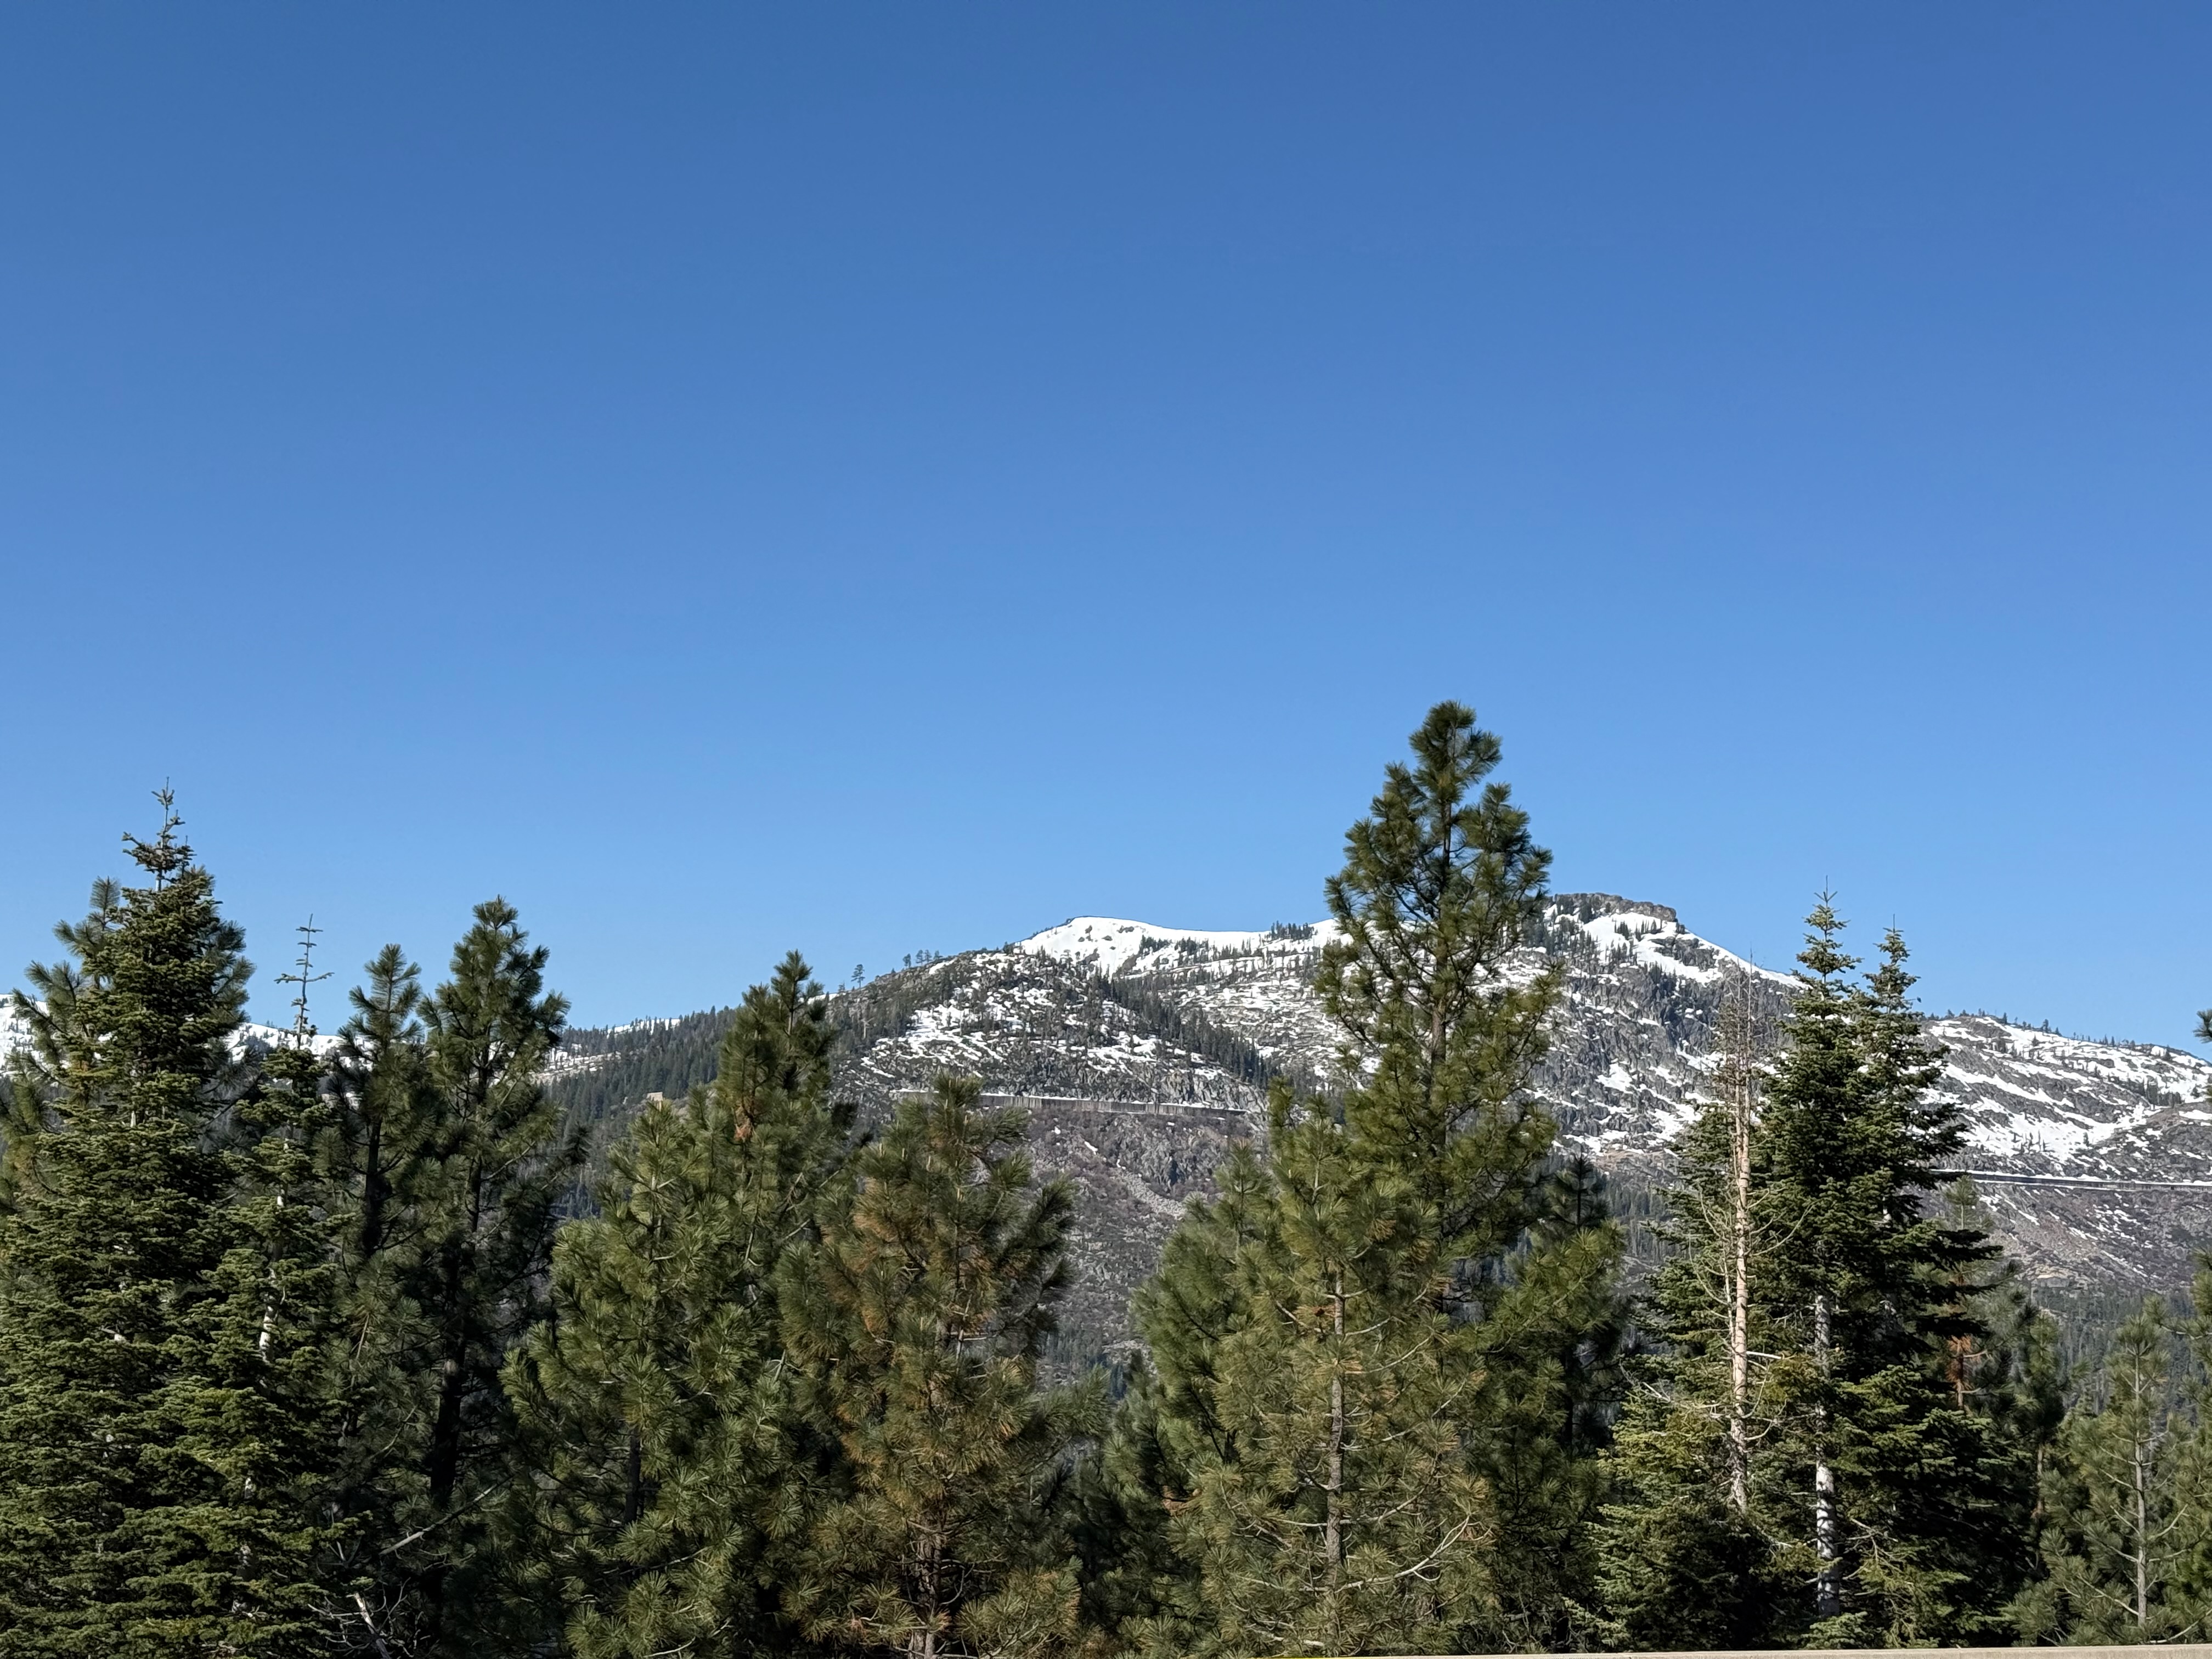 Sierra Nevada from the approach. Snowcapped peaks above timberline, mixed conifer forest below. Drive 4,000 feet up and you cross the equivalent of driving hundreds of miles north.
Climb 1,000 feet in elevation and the temperature drops roughly 3.5 degrees Fahrenheit. Precipitation increases. The growing season shortens. Drive 4,000 feet up a mountain and you cross the equivalent of driving hundreds of miles toward the pole. You see this on Mount Rainier: Nisqually valley Douglas-fir forest to subalpine meadow in a 20-minute drive. Same principle, different mountain.
The ponderosa stands taught me about fire. The trees were spaced wide apart, 30 to 40 feet between trunks, with manzanita and ceanothus filling the understory. That open spacing is not random. Ponderosa pine forests historically burned every 5 to 10 years in low-intensity surface fires that cleared understory growth, killed competing seedlings, and maintained that open, park-like structure. The trees survive because their bark is three or more inches thick at maturity, plated and fissured like a jigsaw puzzle, insulating the cambium from surface flame.
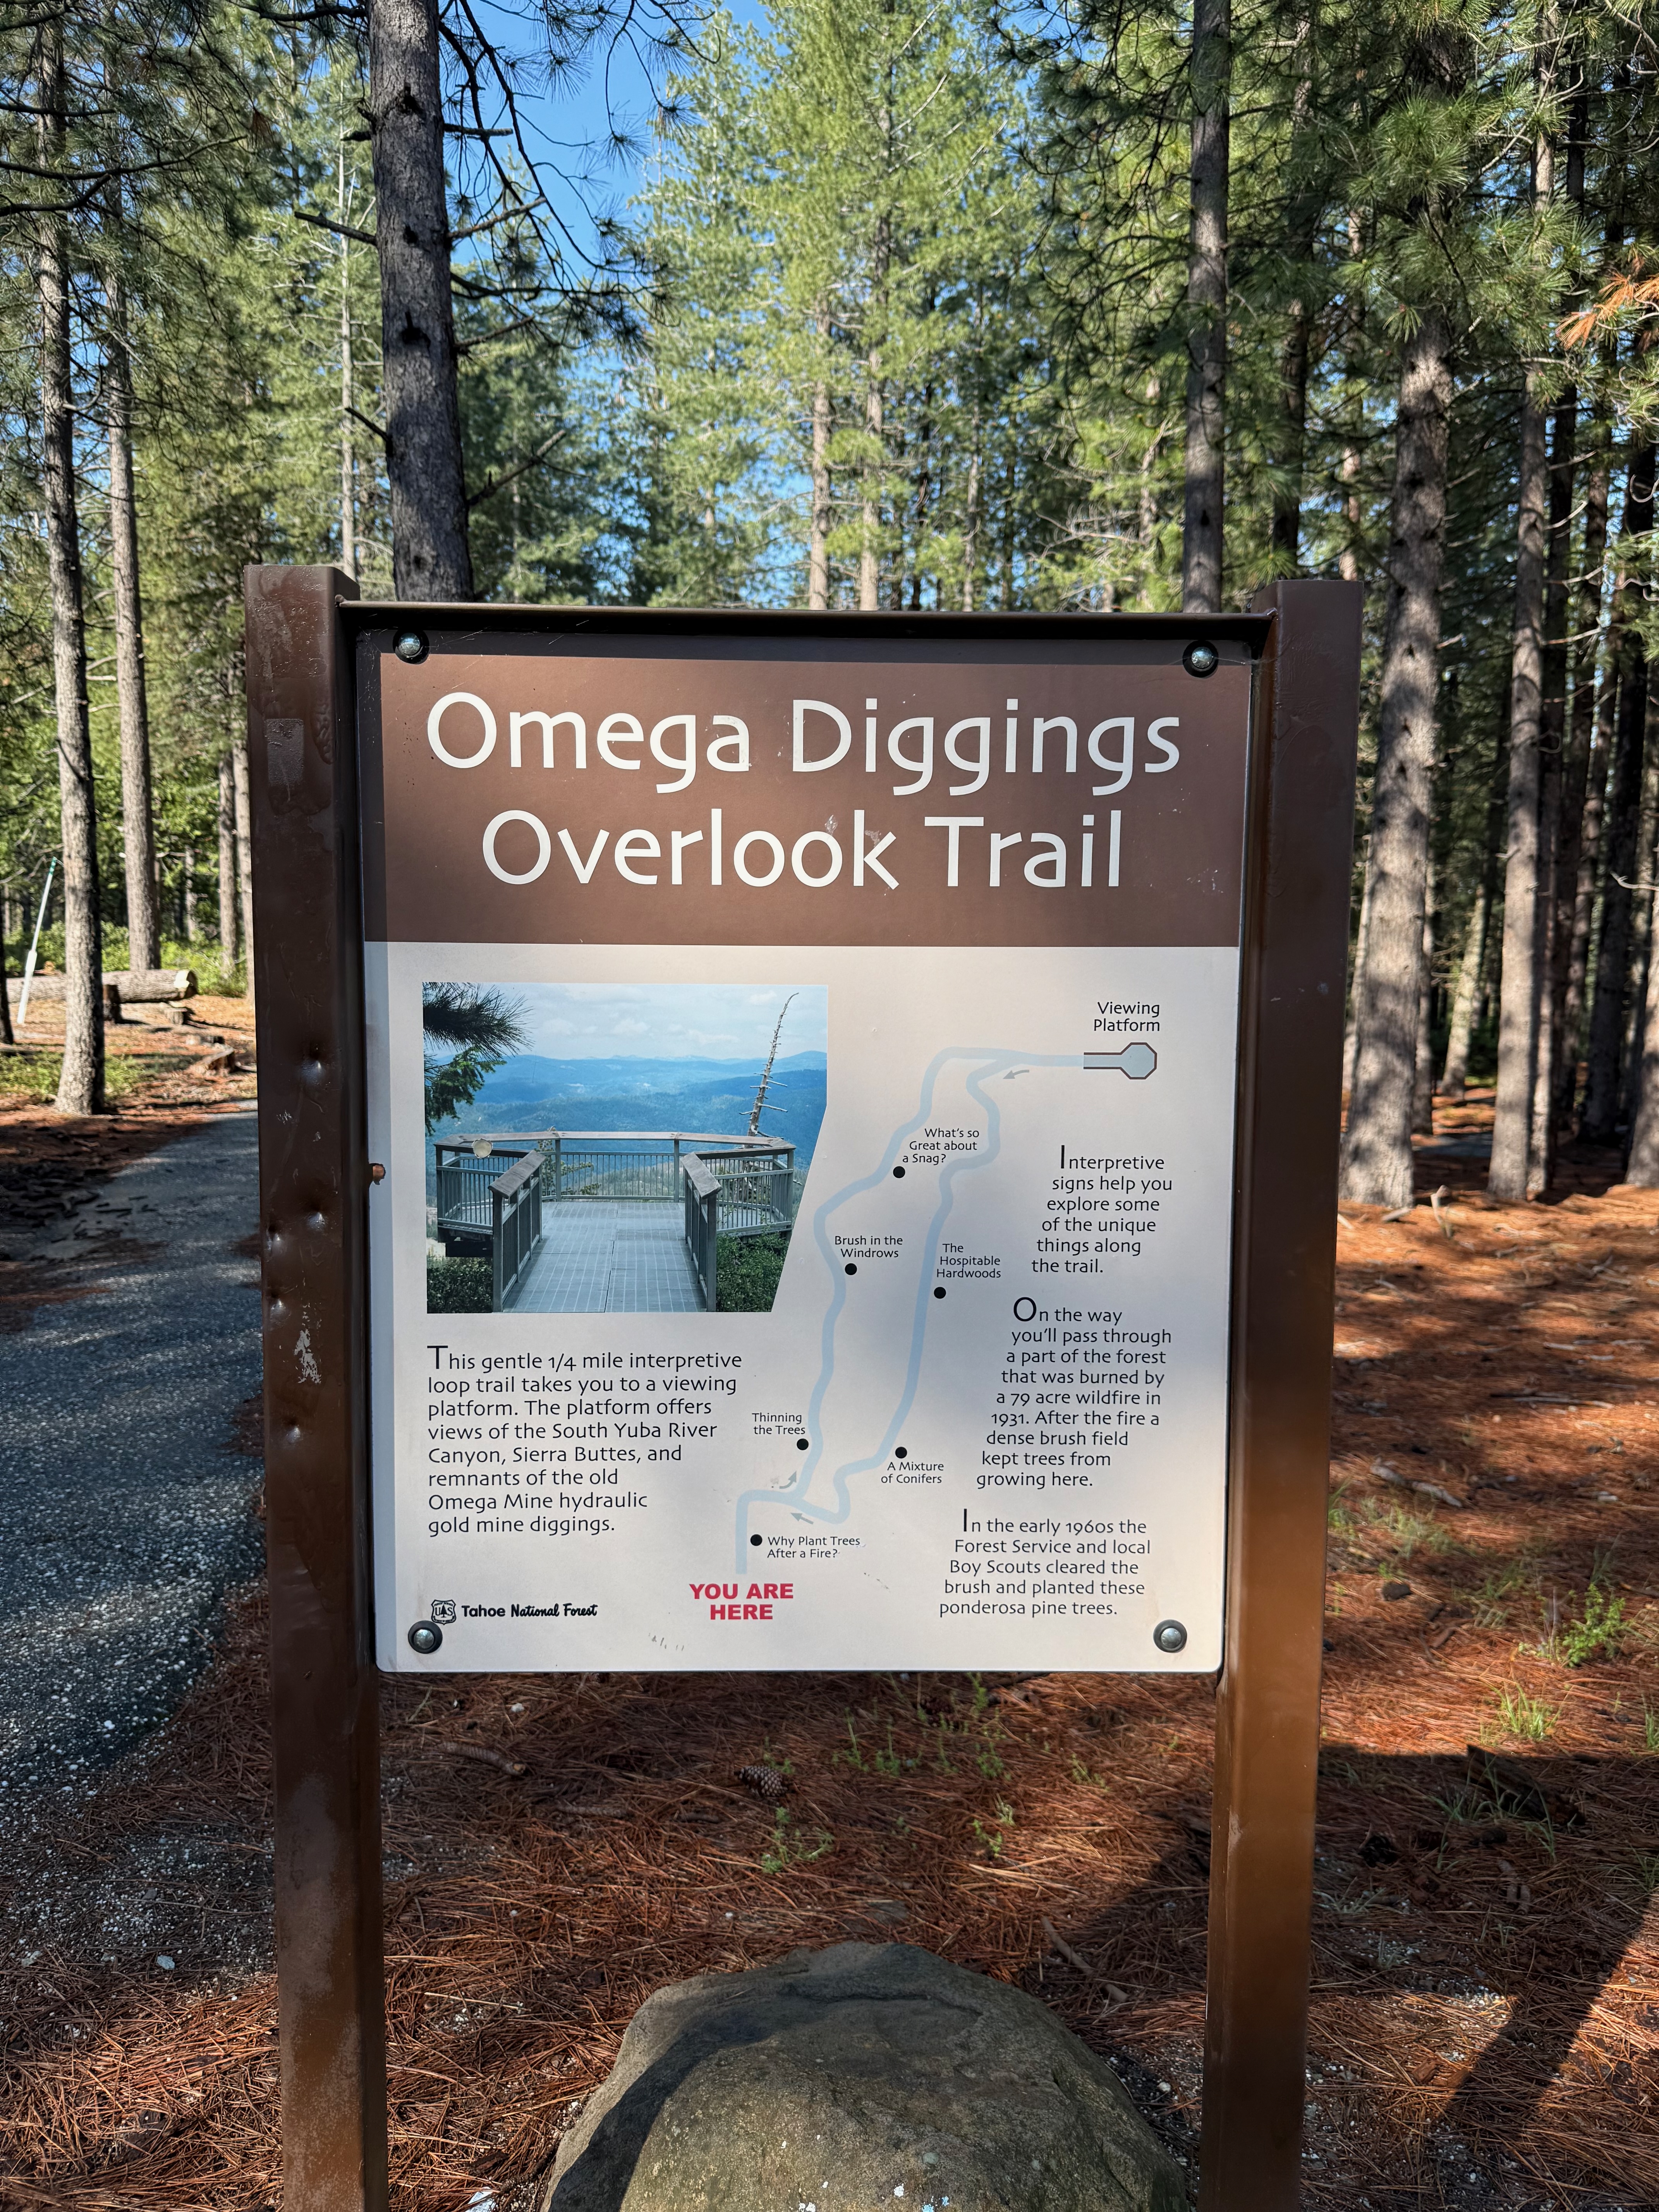 Open spacing between ponderosa pines. This is what fire-maintained forest looks like: wide gaps, low understory, thick bark. Compare to the dense, closed-canopy Douglas-fir forests at home.
Compare that to our forests. Puget Sound Douglas-fir stands are dense and closed-canopy because fire is less frequent here. Longer intervals between burns allow more trees to establish, and the wet maritime climate supports a thick understory of salal, sword fern, and Oregon grape. Forest density tells you about a place’s fire history as clearly as any chart.
The best moment on the Sierra crossing came at Omega Overlook, where I stood above a fog inversion and looked down into a cloud sea. Conifer tops emerged from the fog like islands. The valley below was invisible, socked in by a temperature inversion that trapped cool, moist air below the ridgeline while the peaks above stood in bright sunshine.
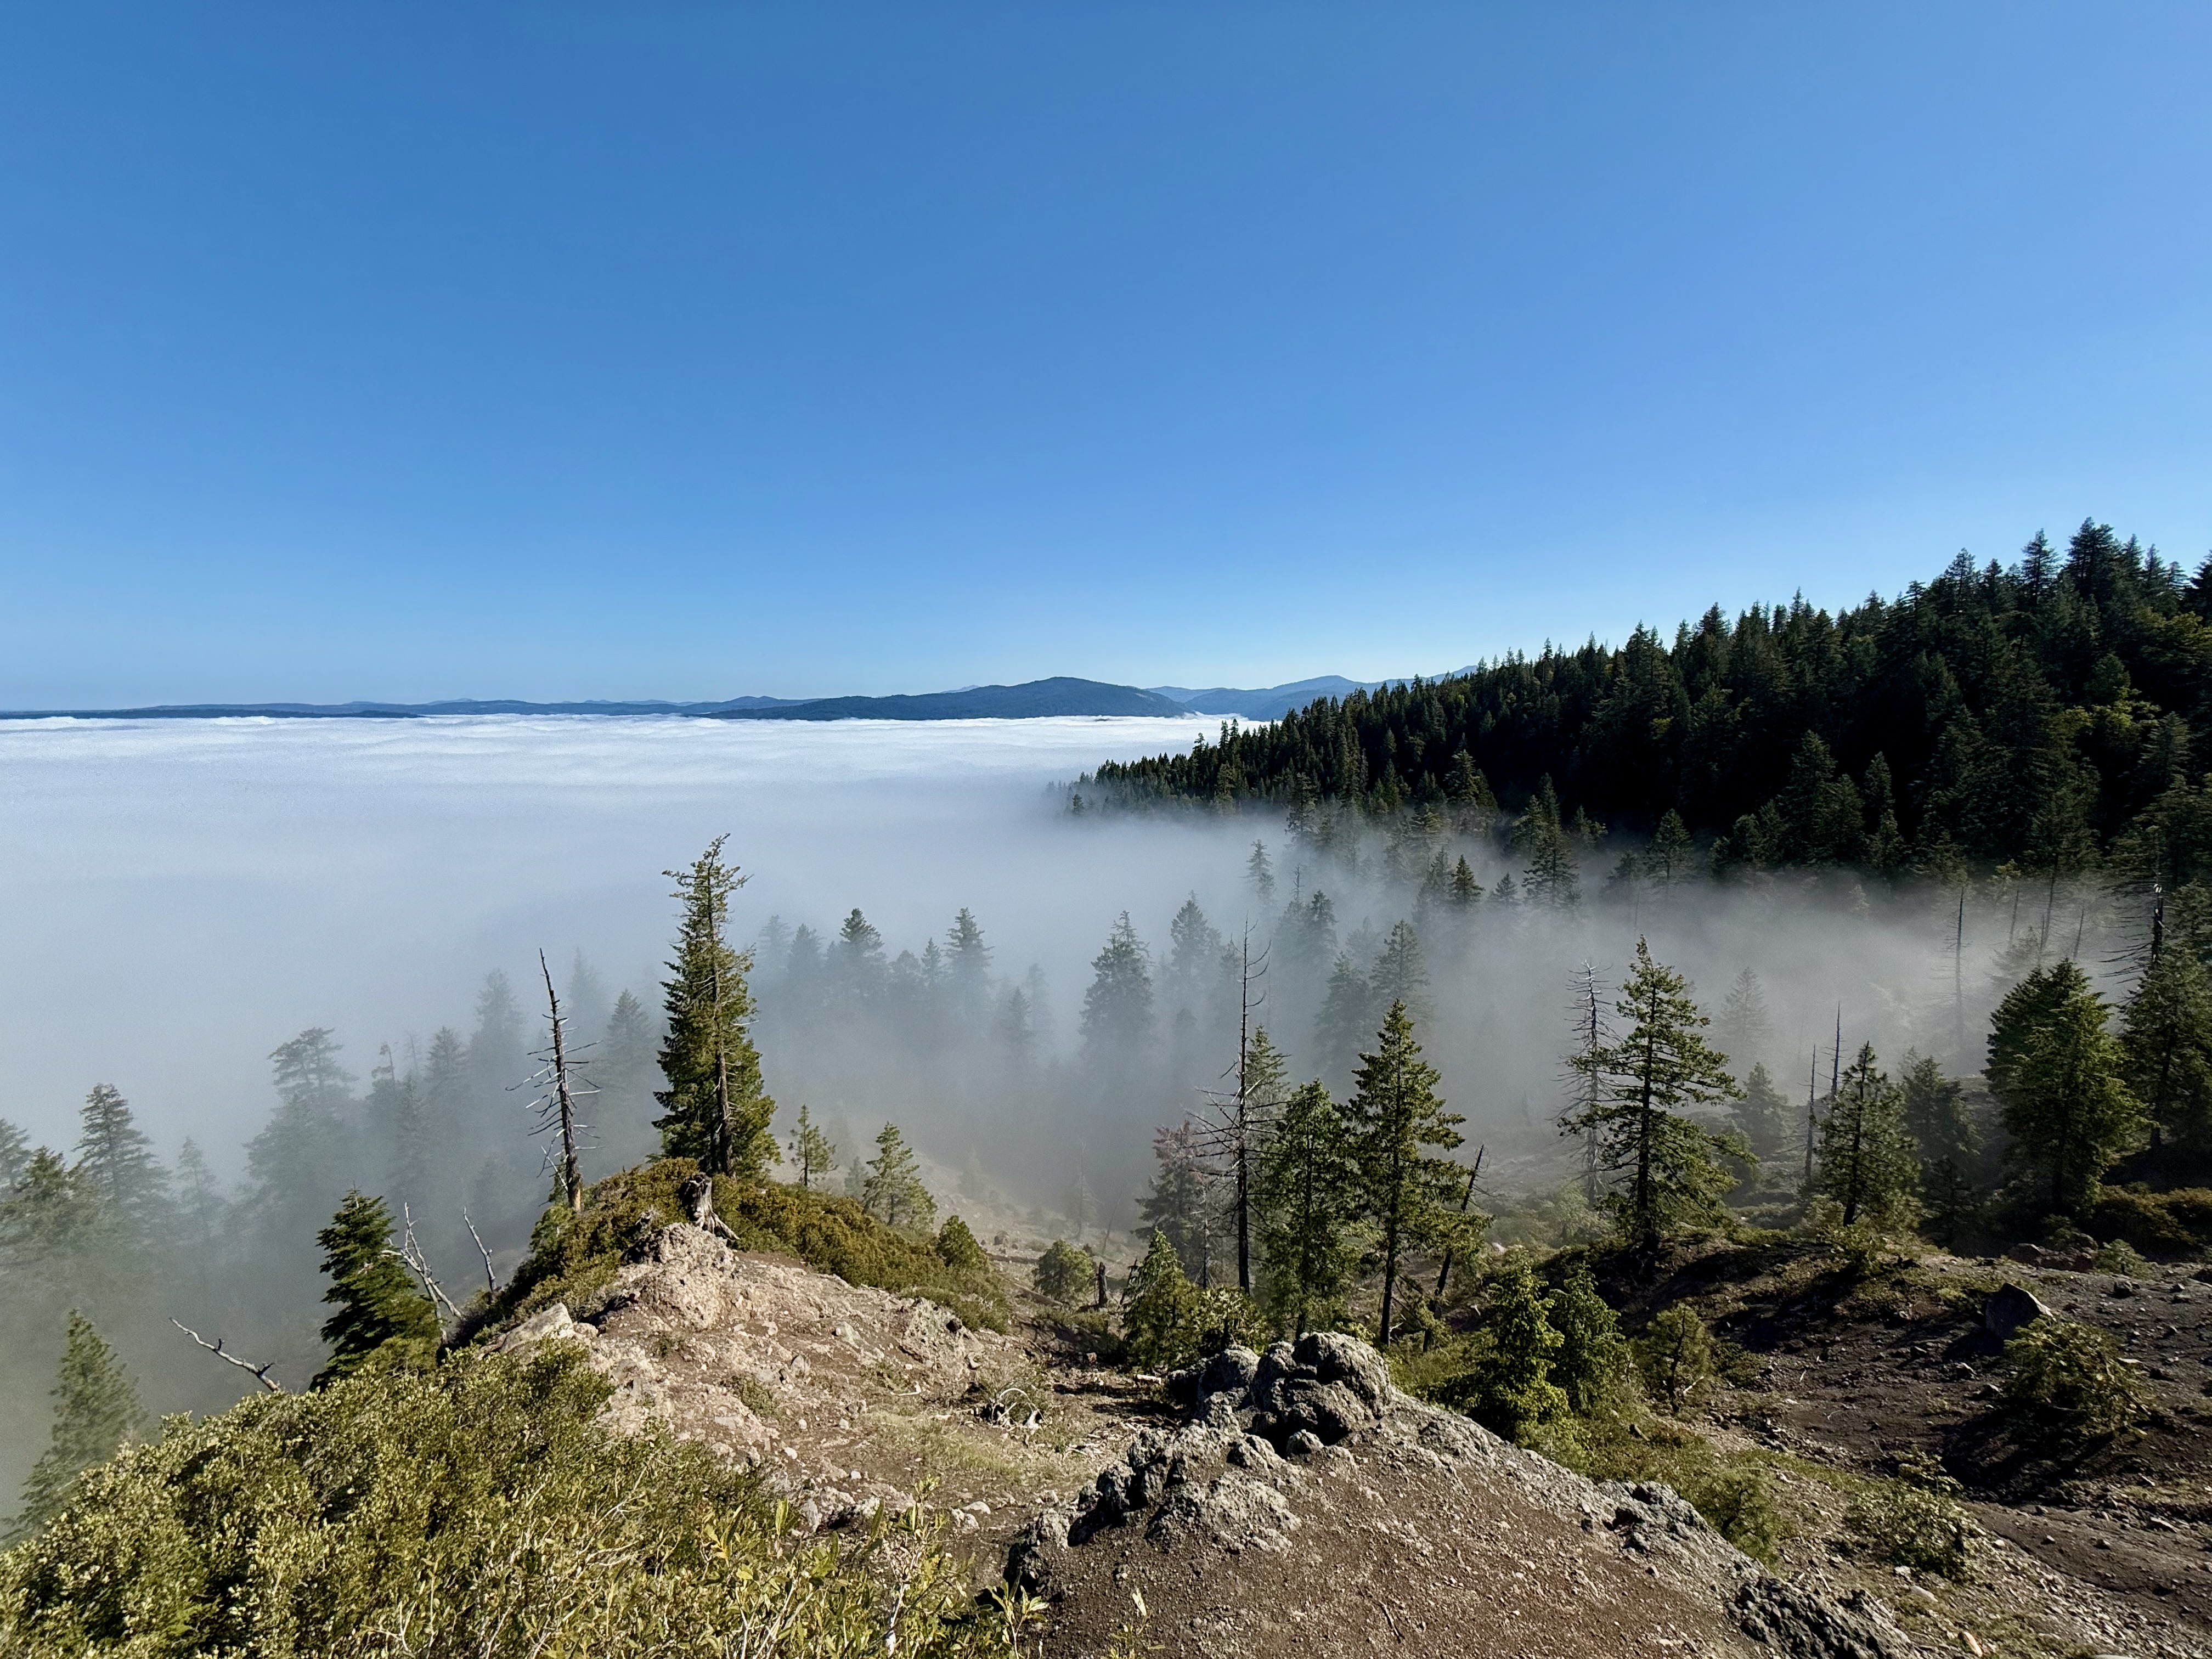 Fog inversion from Omega Overlook. Cool, moist air trapped below the ridgeline. The same physics as a Puget Sound marine layer, different mechanism, same result: moisture concentrating below a certain elevation.
That is the same physics as a Puget Sound marine layer. The mechanism differs (radiation fog pooling in a mountain valley versus advection fog rolling off the ocean), but the result is identical: moisture concentrating below a certain elevation, shaping the vegetation on either side of the line. At home, you see this when morning fog sits in the Kent valley but burns off on the hillsides above Auburn by 9 AM. The trees on that valley floor are getting more moisture than the trees 200 feet uphill, and it shows.
Observation skill: When you look at a mountainside and see bands of different green, you are seeing climate zones. Count the bands, and you are reading the elevation.
Clear Lake: The Anti-Puget Sound
I dropped out of the Sierra and reached Clear Lake in Lake County, California, by late afternoon. The landscape change was immediate and total. The conifers disappeared. Rolling hills covered in scattered live oaks and grass replaced them. And the grass was already brown.
Brown grass in the first week of May. Let that register. At home, our lawns are at peak green in early May. Here, the growing season for annual grass was already over.
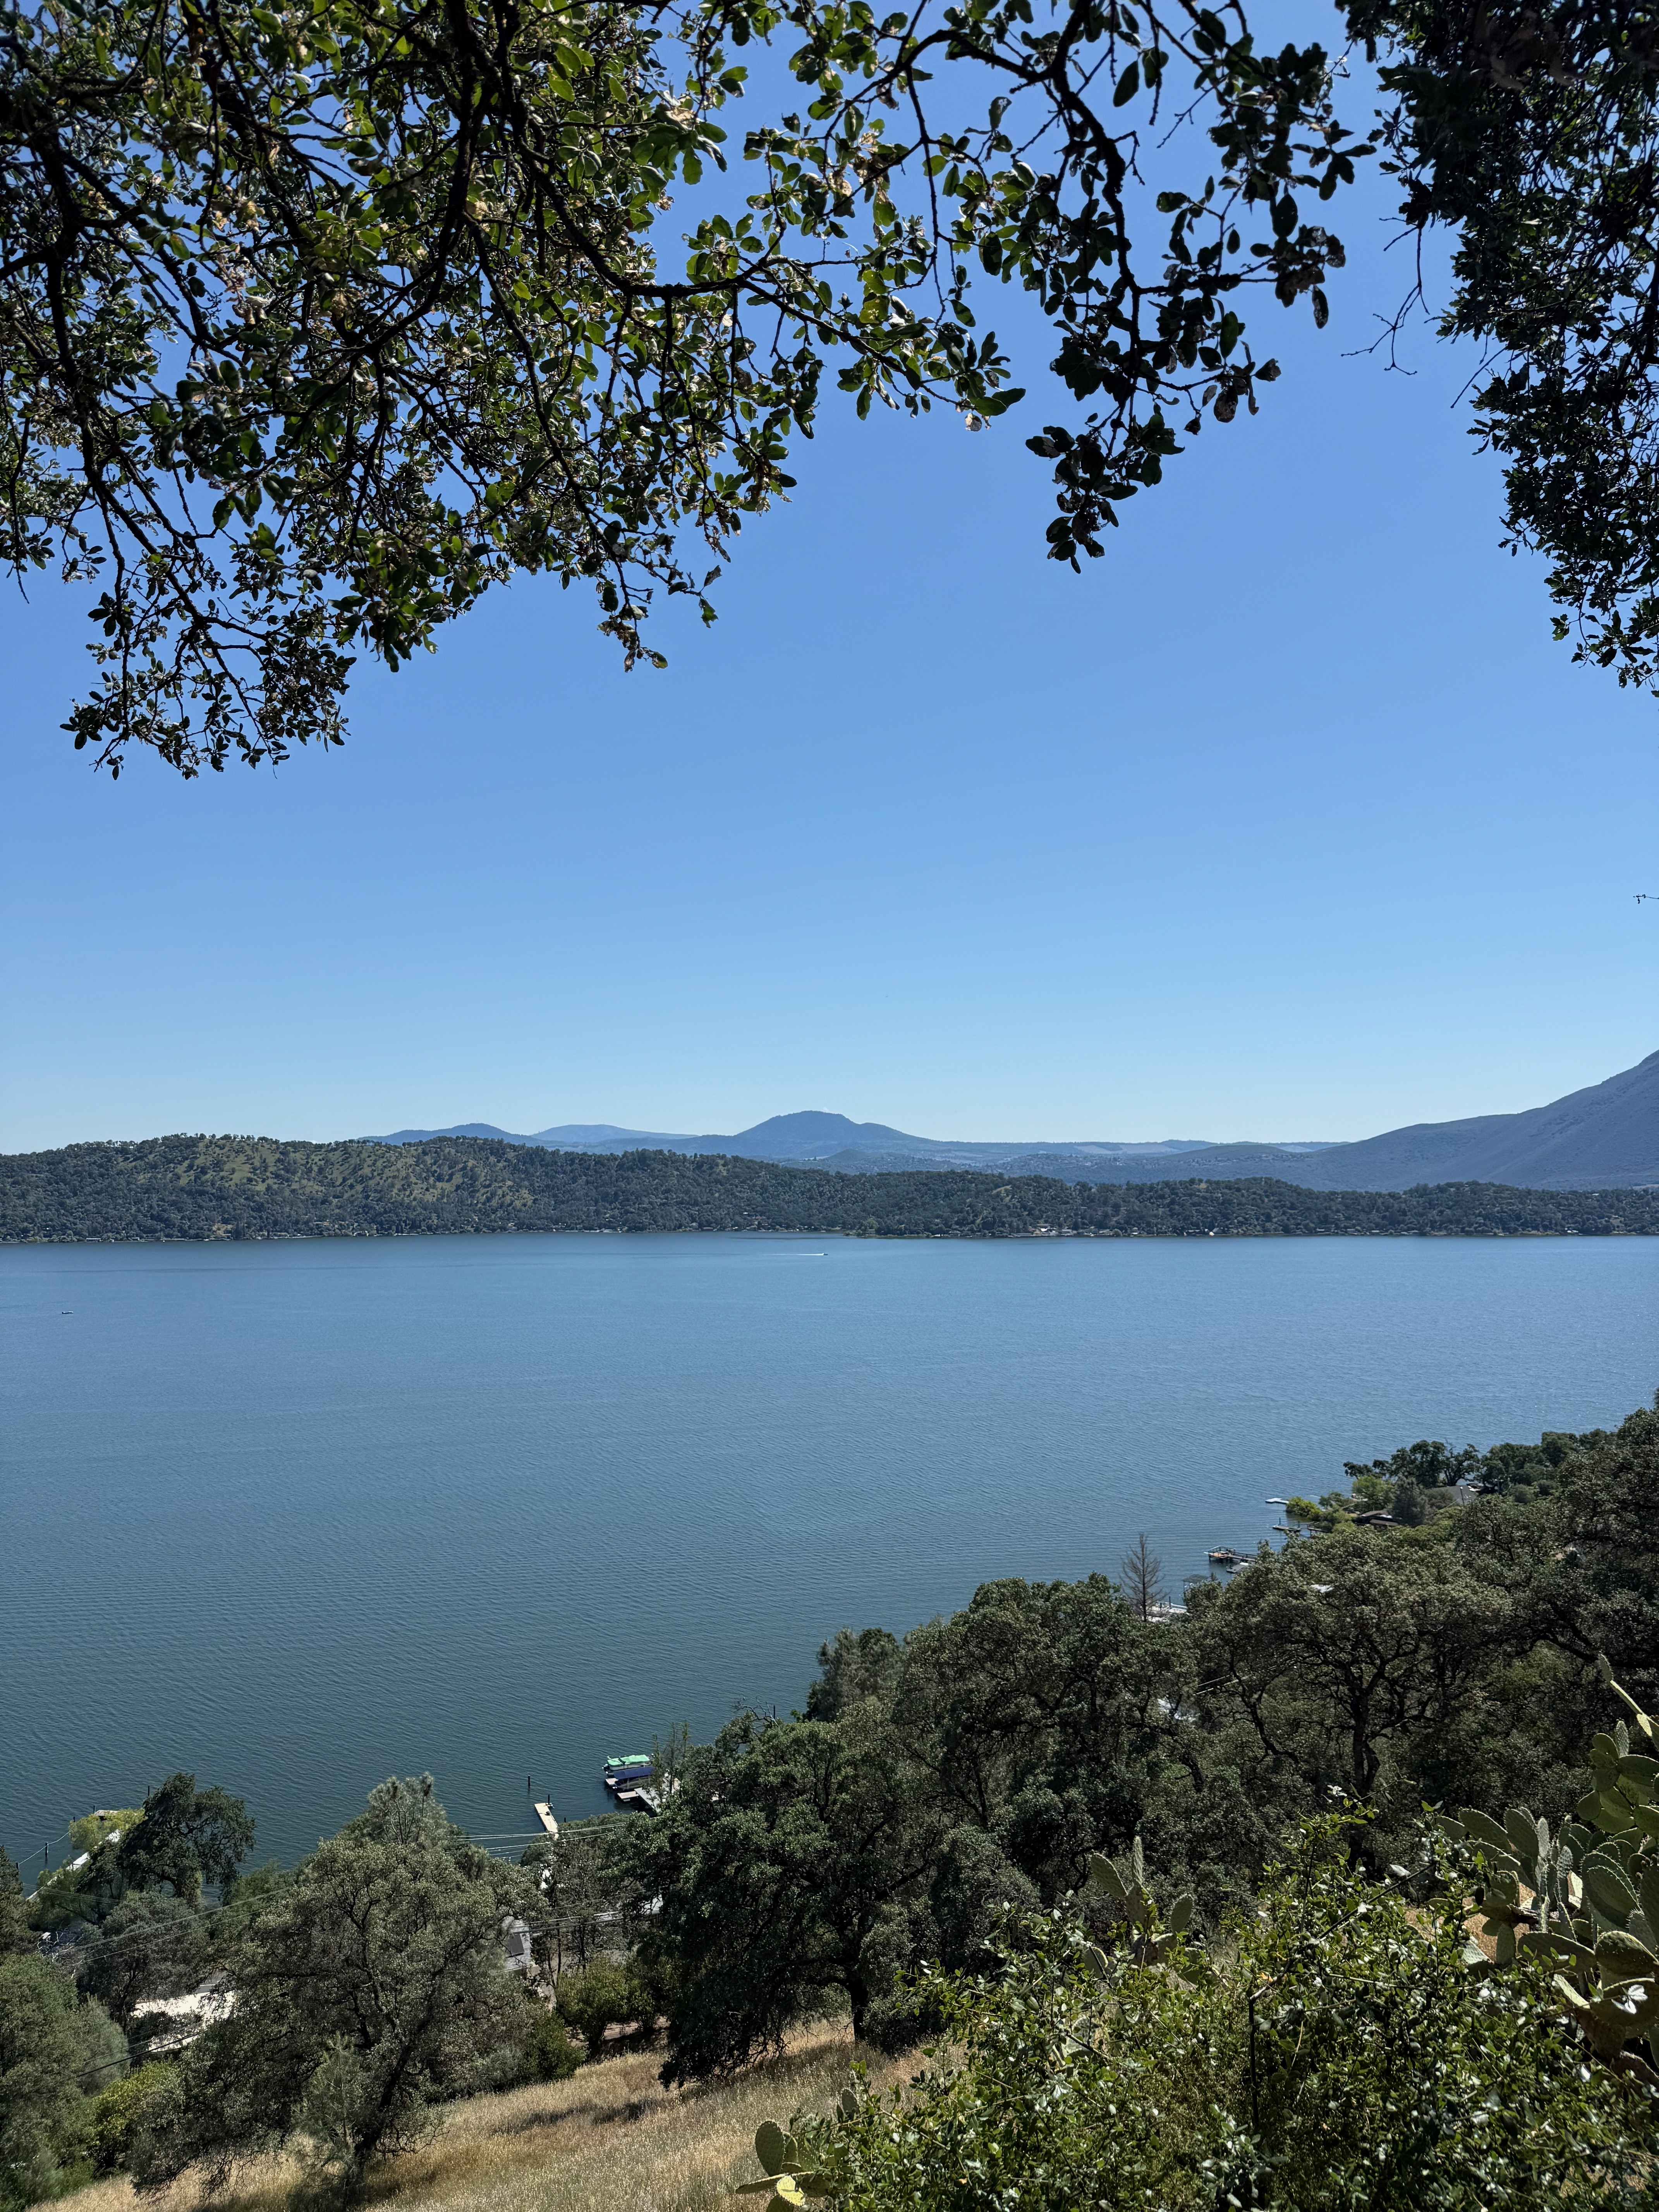 Clear Lake, California. Oak savanna with browning grass in early May. Same annual rainfall as parts of this region, completely different timing.
Clear Lake gets 25 to 30 inches of annual rainfall. Kent gets 37 to 40. The totals are closer than the landscapes suggest, but the timing is not: Clear Lake’s rain falls entirely between October and April. Summer is bone dry. The result is a Mediterranean climate signature that looks nothing like home despite only a 30 percent difference in annual precipitation. Different timing, completely different landscape.
The wide-spaced oaks on the hillsides are the structural expression of that climate. Oak savanna appears in Mediterranean climates worldwide, from Spain to central Chile to southwestern Australia. The pattern exists because trees must be sparse enough that each one can survive summer drought on the soil moisture its root zone captures during winter rains. The grass between them completes its entire lifecycle before the soil dries, germinating in October, growing through winter, and senescing by May.
Gray pine (Pinus sabiniana) showed up in the chaparral transition zone, and it is worth knowing as a marker species. Its crown is open and sparse, with long, drooping gray-green needles in bundles of three casting almost no shade. That open canopy is a drought adaptation: fewer needles means less water lost through transpiration. It is the structural opposite of western red cedar’s dense, layered canopy, which evolved in a place where water is abundant year-round. If you can read canopy density, you can read a landscape’s water budget.
The next morning, fog pooled over Clear Lake at dawn, clinging to the volcanic hills surrounding the water. By 9 AM it had burned off completely. At home, that same marine-layer fog can linger until noon because the ambient air is already saturated. The fog burned off fast at Clear Lake because the air above it was dry. Fog duration tells you about the moisture content of the air column above it, not just the temperature at the surface.
Observation skill: Look at the grass. Green or brown? That single observation tells you more about a place’s summer climate than any weather chart.
The Redwoods: What Maximum Moisture Produces
Nothing prepared me for what I saw at the Avenue of the Giants.
I had read about coast redwoods. I knew the dimensions. I had seen photographs. None of it mattered. Driving under trees that block out the sky for miles, trees that were alive when Rome fell, trees with bark a foot thick and fire scars you could park a truck inside, is a fundamentally different experience from reading about it.
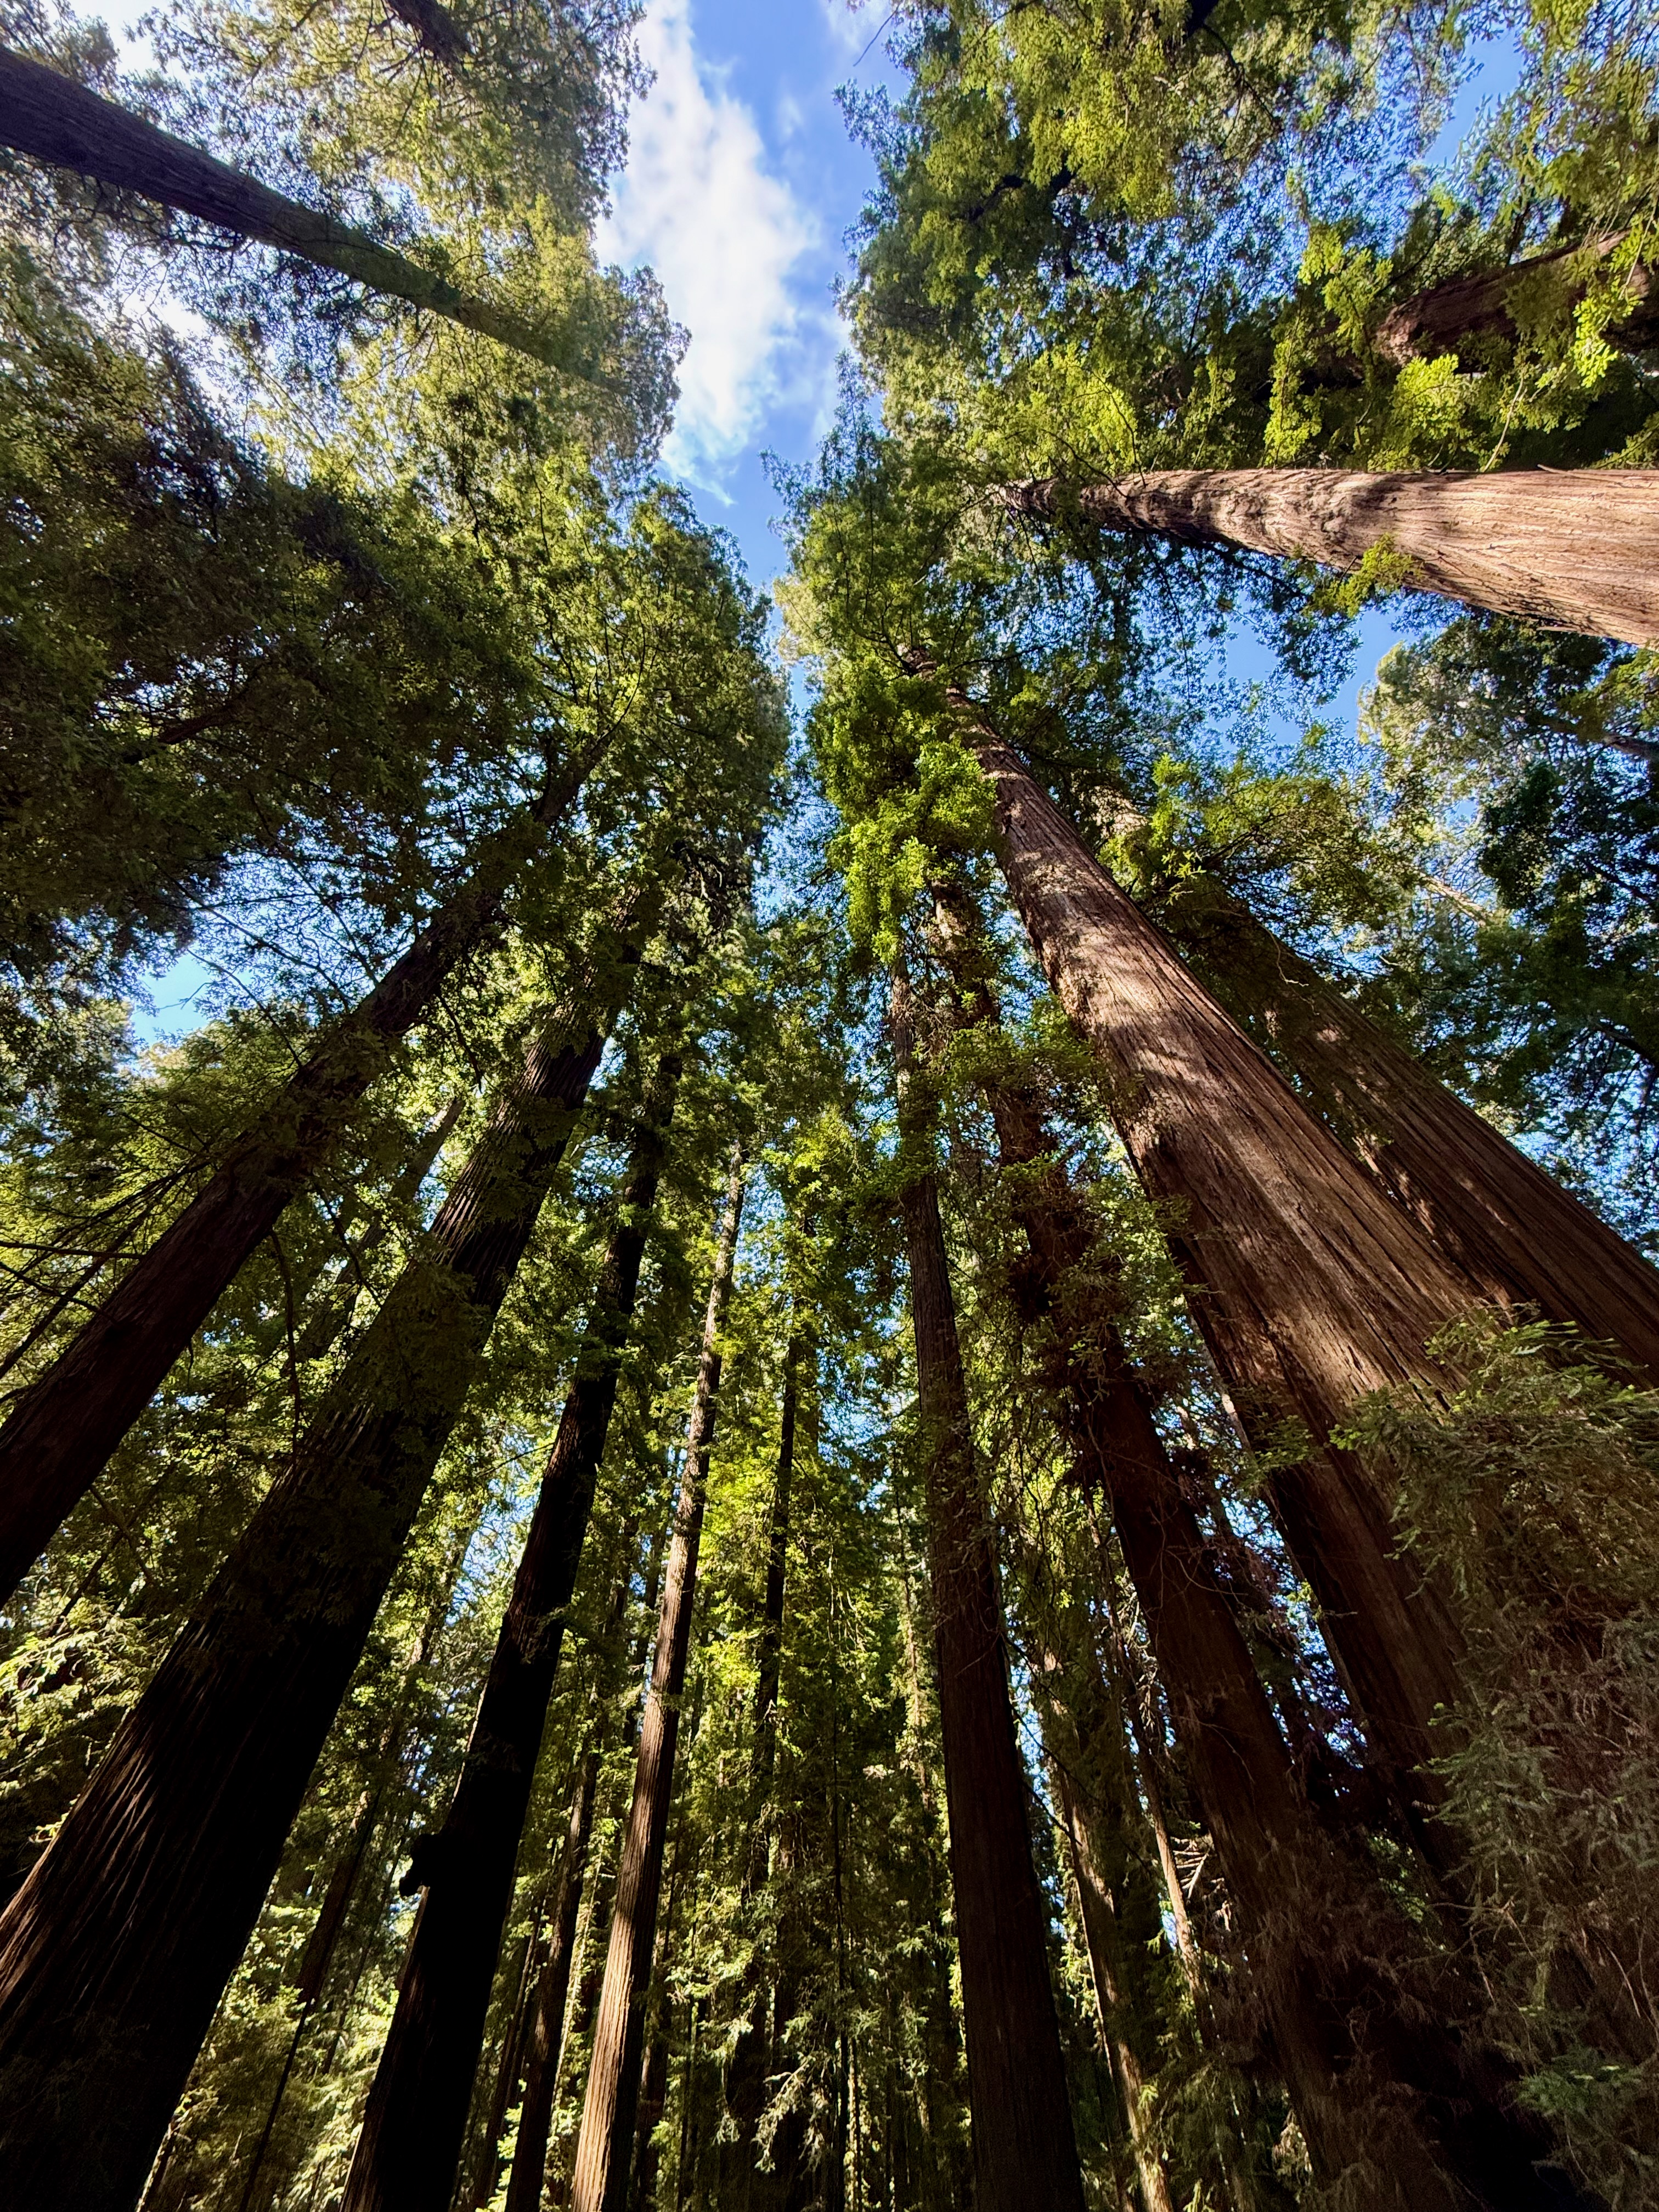 Looking straight up through old-growth coast redwood canopy. 250 feet of trunk before the first branches. Five canopy layers between you and the sky.
Coast redwood (Sequoia sempervirens) is the tallest tree species on Earth, and the forest it builds is the most structurally complex temperate ecosystem in North America. Start with the canopy. Looking up, I counted layers: the emergent redwood crowns at 250 feet, a secondary canopy of Douglas-fir and tanoak at 100 to 150 feet, an understory of bay laurel and madrone, a shrub layer of rhododendron and huckleberry, and a ground layer of sword fern and redwood sorrel. Five layers. A young plantation has one. Layer count is how you read forest maturity. At home, look up through your neighborhood’s canopy and count the layers. More layers mean more complexity, more habitat, more ecological function.
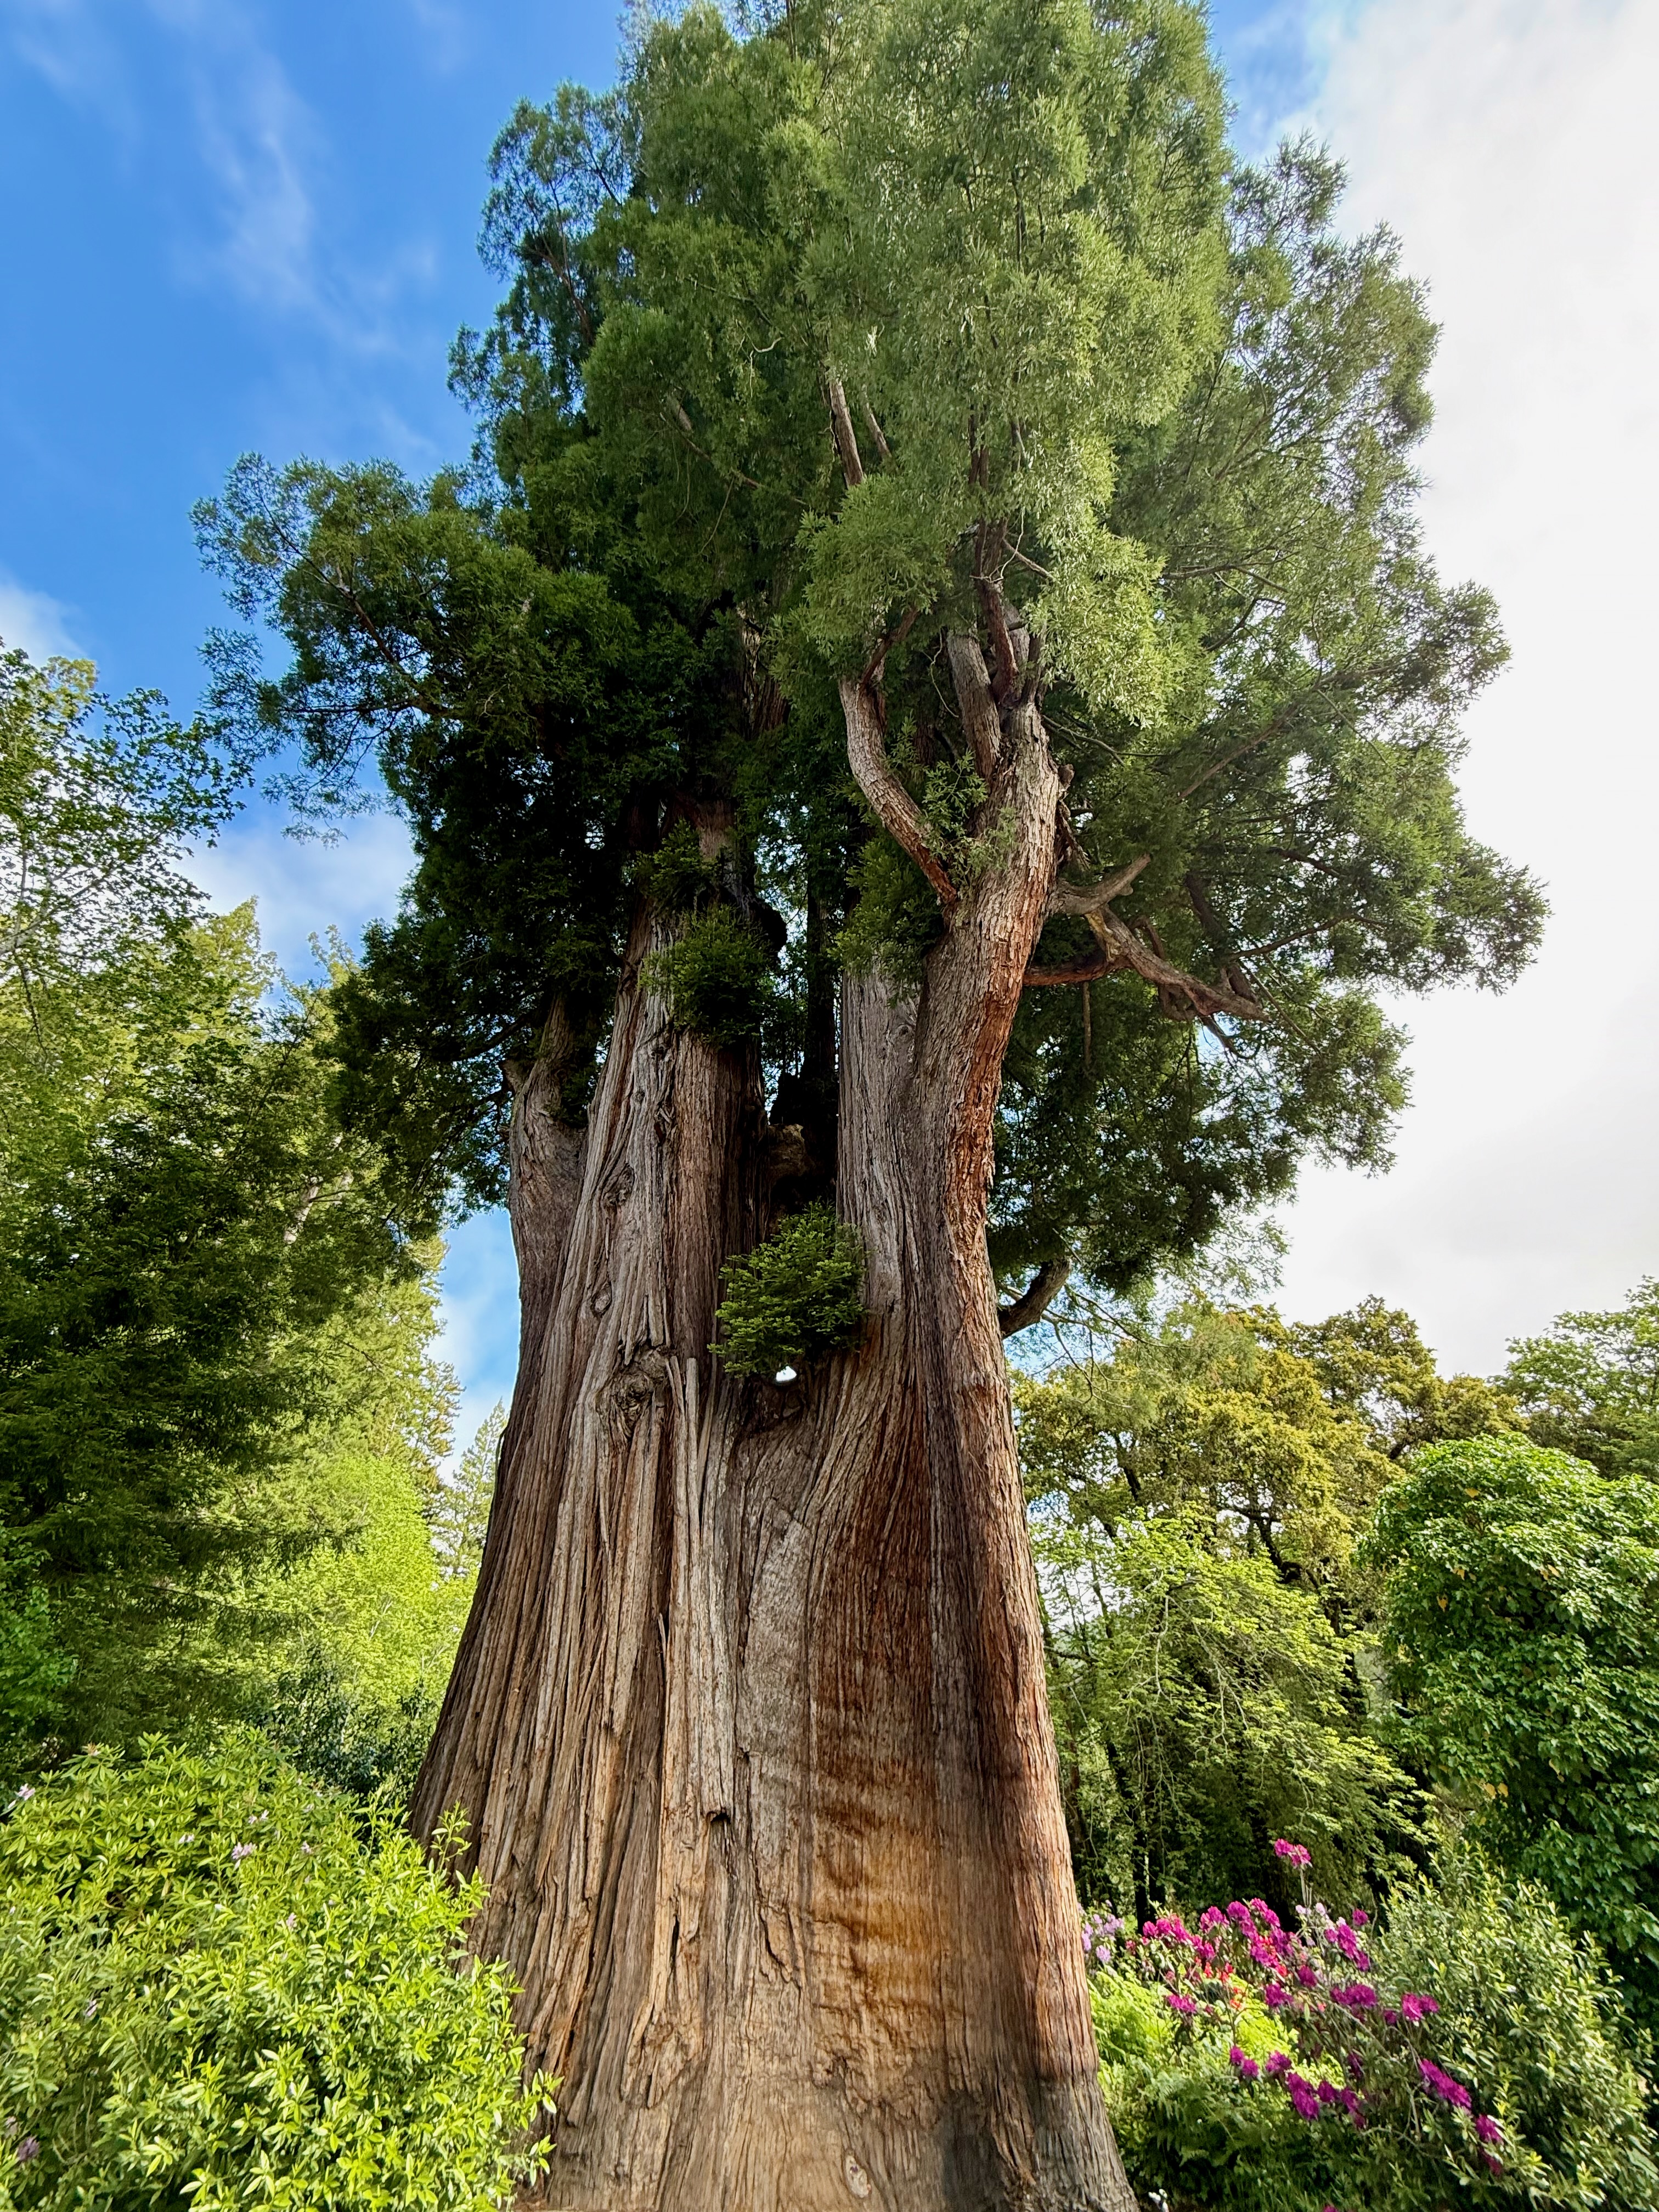 Heritage redwood with rhododendrons at the base. Scale is impossible to capture in a photograph.
The fog is the key to everything. Coast redwoods get roughly 34 percent of their annual water from fog drip: Pacific fog rolls in, condenses on millions of needle surfaces, and drips to the forest floor. During summer drought, fog provides up to two-thirds of the understory’s water. This is the mechanism that ties the redwoods to the coastline. Move 30 miles inland and the fog does not reach; the redwoods stop. The species is not limited by cold or soil. It is limited by fog.
That same mechanism operates, at smaller scale, along the Puget Sound coast. Our marine layer and low summer clouds deliver moisture to coastal forests through the same condensation physics. The redwoods show you the principle at maximum expression. Your coastal garden gets the same gift at a fraction of the intensity.
The forest floor tells its own story. Redwood sorrel carpeted every inch of ground in a continuous green mat. Sword fern fronds arched from every slope and bank. Where sword fern and redwood sorrel both thrive, you are reading the conditions: deep shade, consistent moisture, mild temperatures year-round, acidic soil from centuries of needle decomposition. Your own sword fern patches at home are telling you the same thing. Wherever sword fern thrives in your yard, you have redwood-coast conditions in miniature.
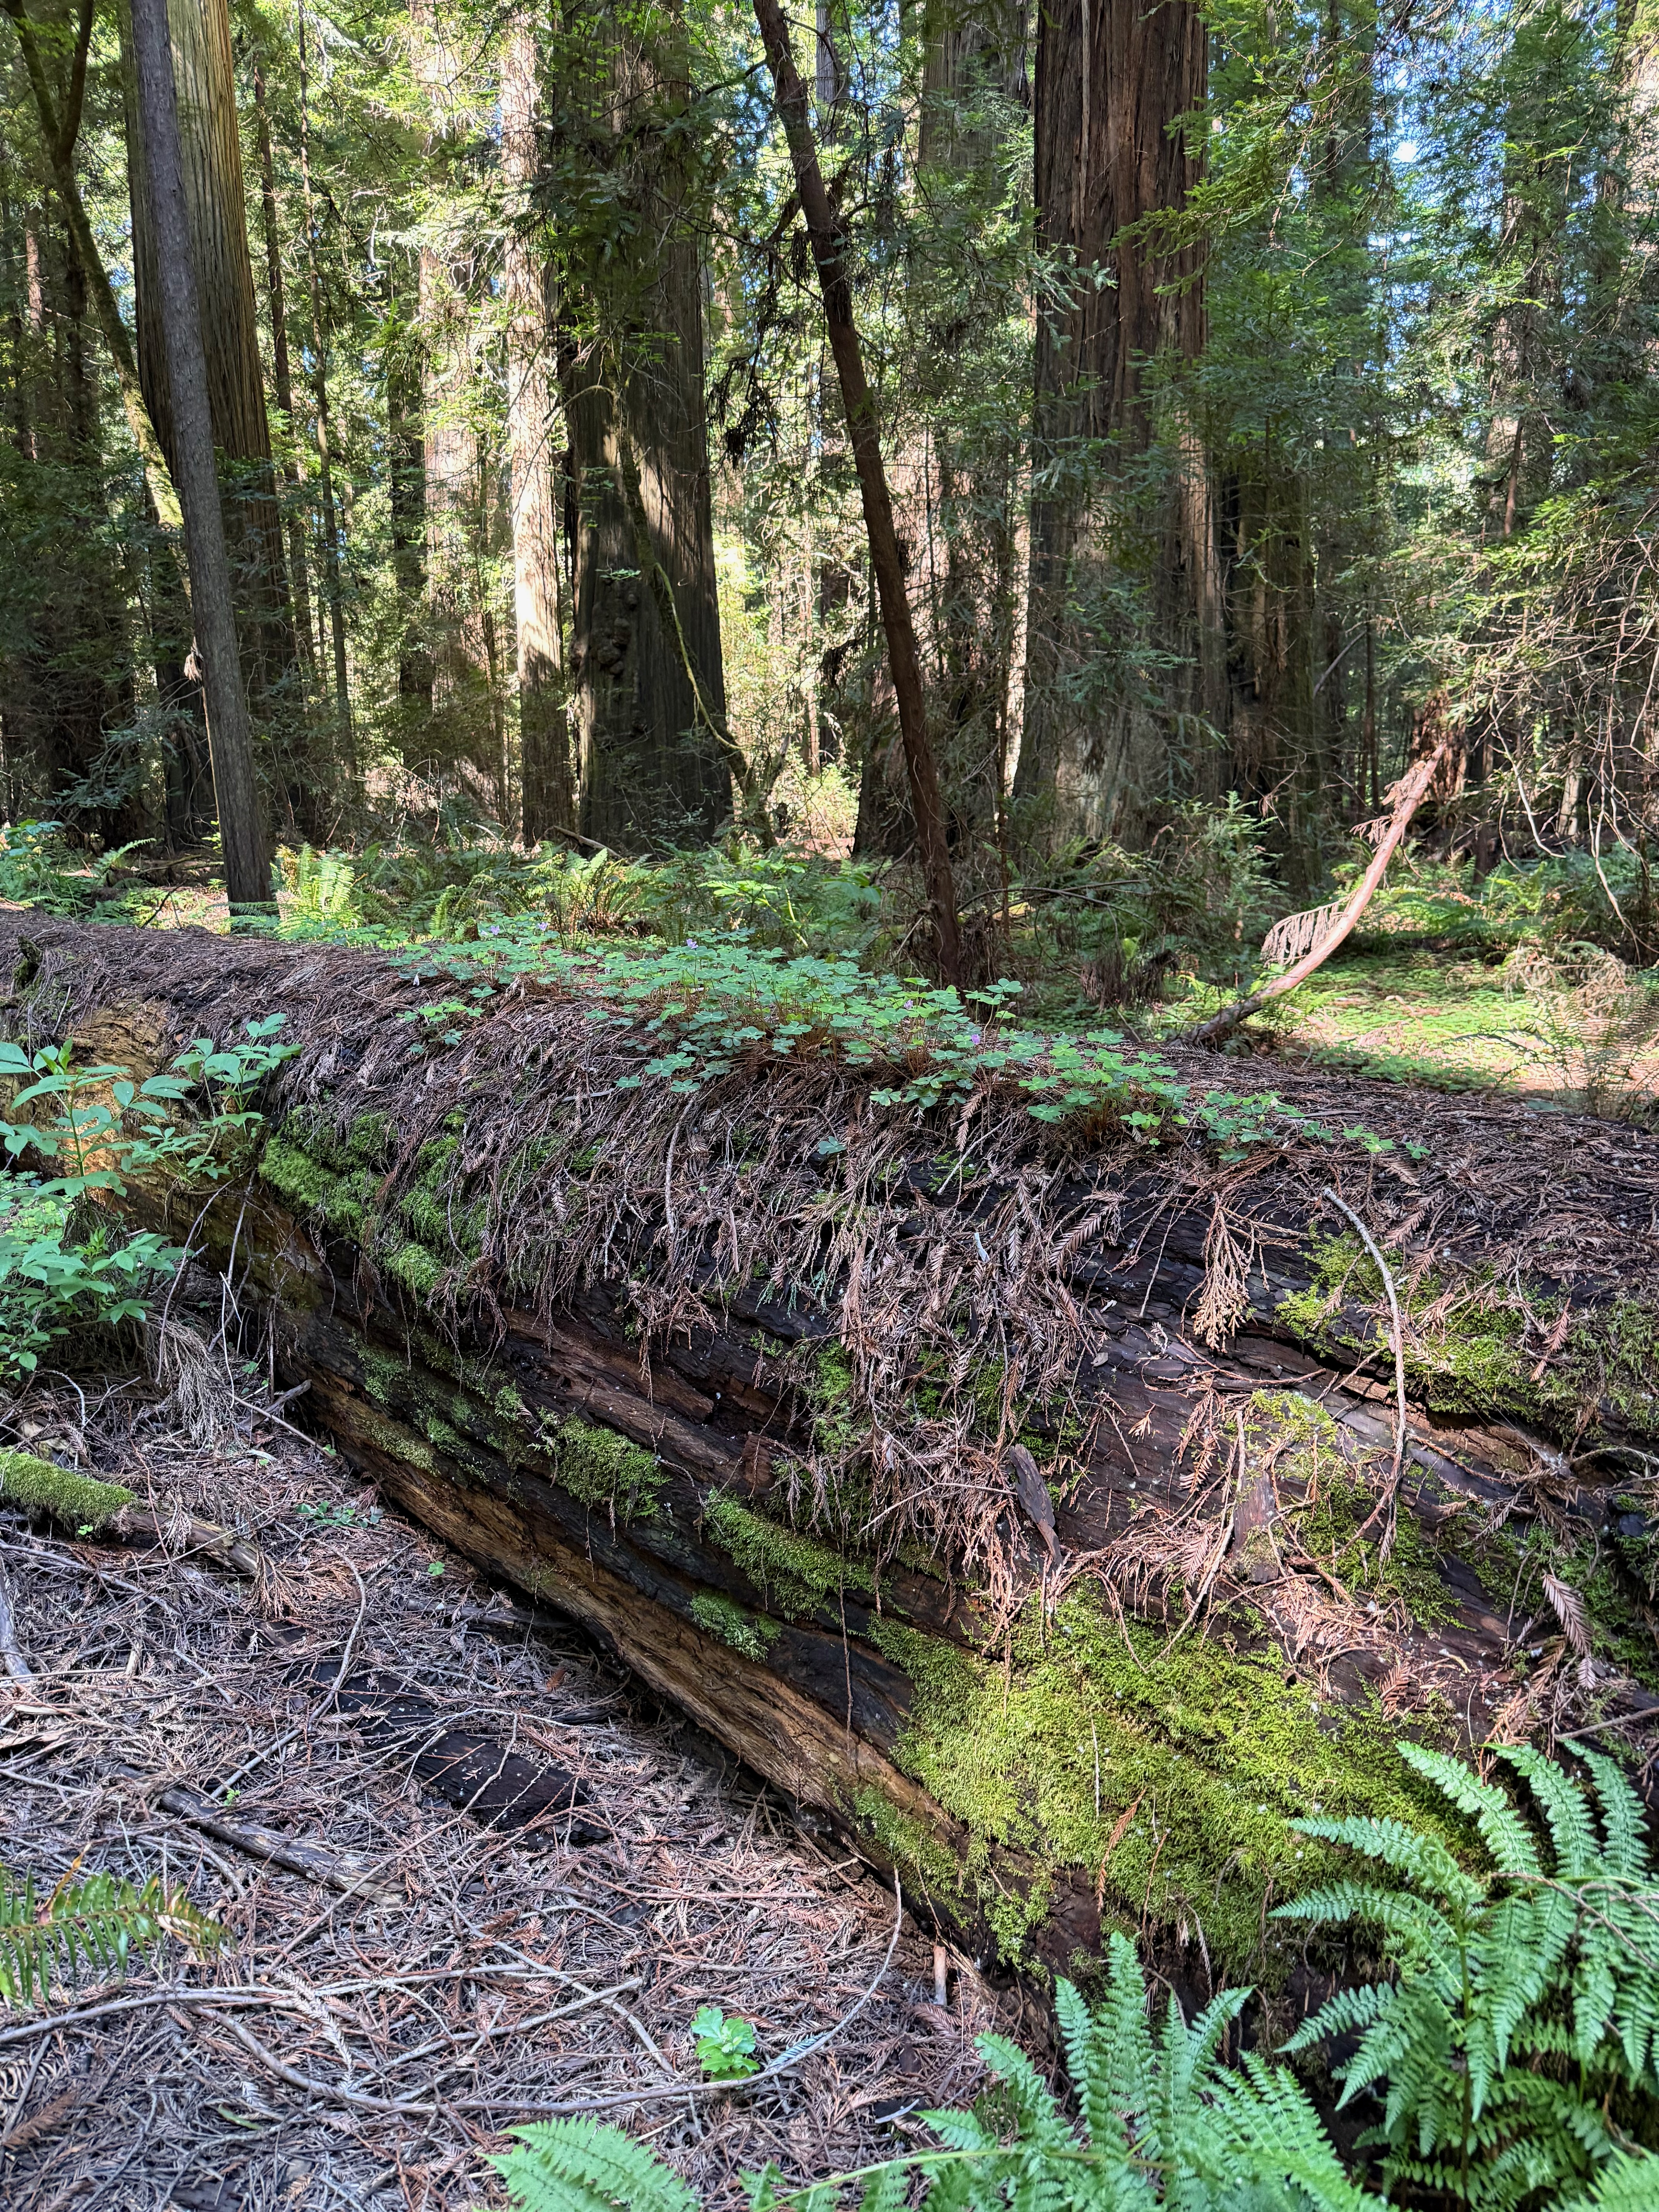 Nurse log. A fallen redwood becoming the platform for the next generation. The same process that operates in every mossy stump in your woodland garden.
I spent a long time looking at a nurse log: a fallen giant colonized by ferns, mosses, and redwood seedlings. Seedling density on nurse logs runs nearly five times higher than on the forest floor because the elevated surface puts young plants above the competition for light and away from the thick duff layer that can smother germination. This is how temperate rainforests build complexity: through decomposition, not deposition. The rotting stump in your garden is not debris. It is infrastructure.
The fire scars stopped me cold. Old-growth redwoods with basal cavities you could stand inside, charred black on the interior, the tree perfectly healthy above. Coast redwood bark grows up to 12 inches thick at the base and contains tannic acids that retard flame. The wood has almost no flammable resin. And when fire does break through, the tree can activate dormant buds that have been waiting under the bark for centuries. Researchers documented buds over a thousand years old sprouting after fire damage. Compare that to Douglas-fir, which also has thick, corky bark as a fire adaptation but lacks the sprouting ability. Both species evolved with fire. They just solved the problem differently.
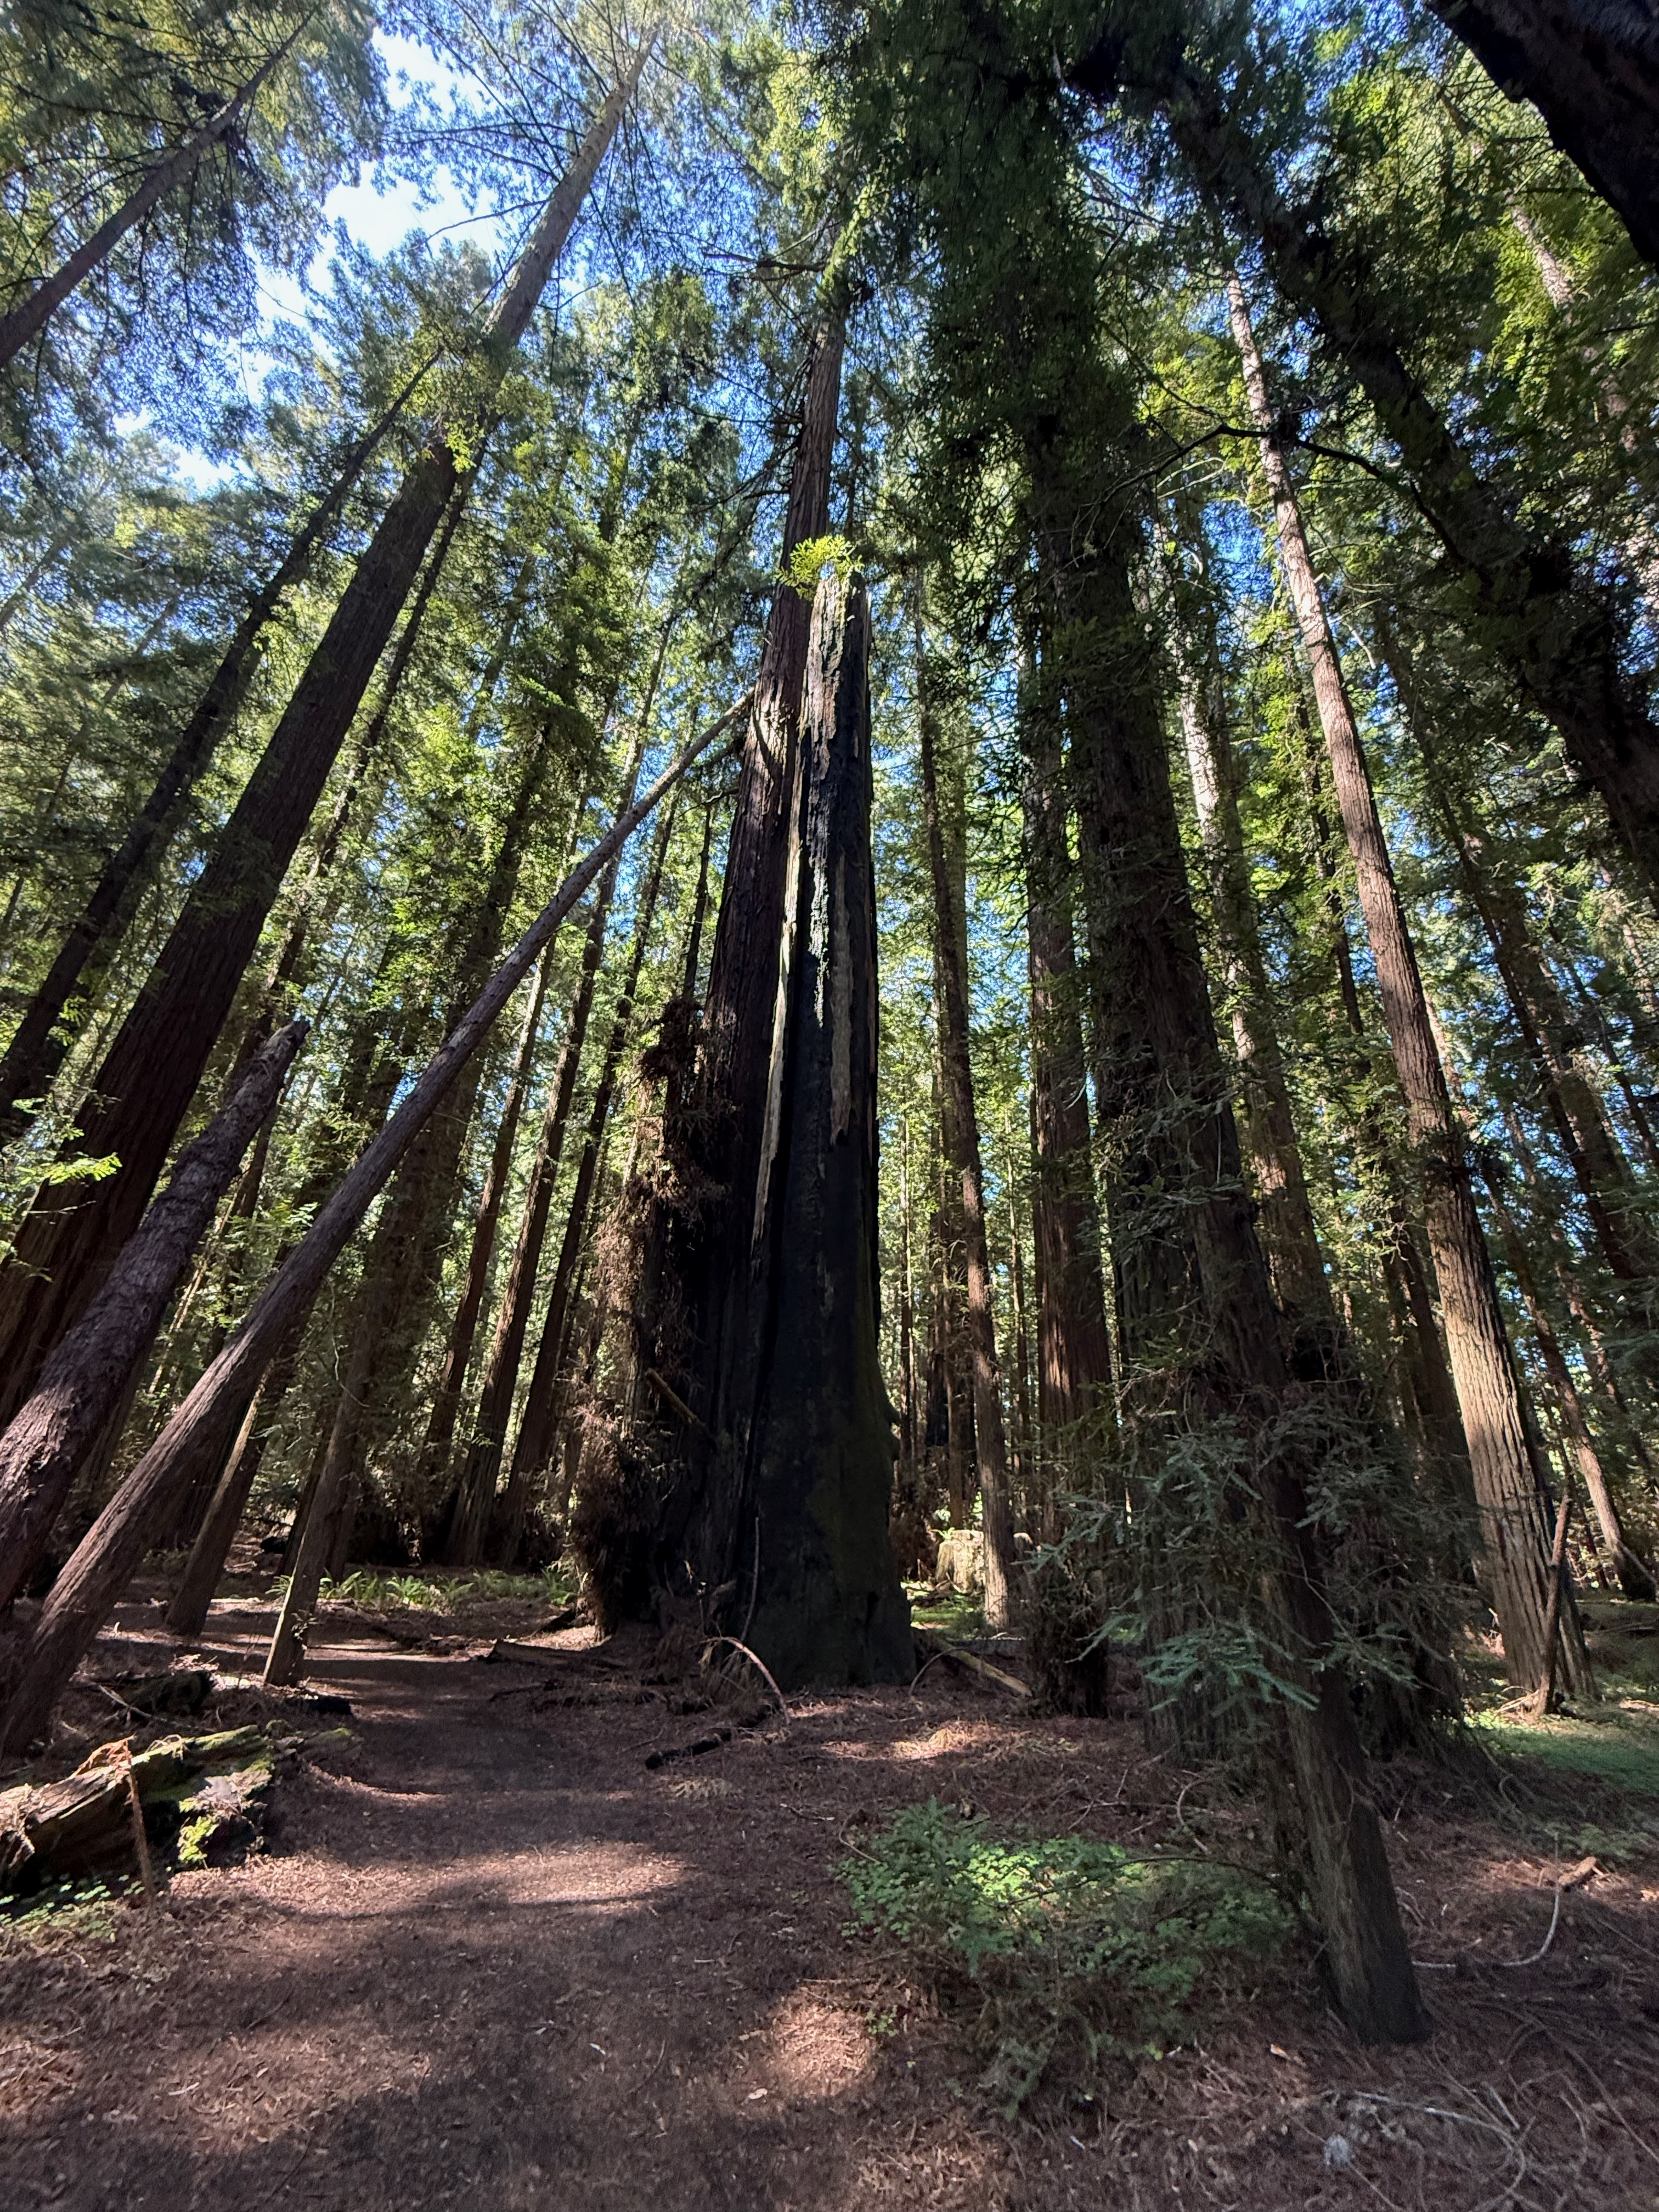 Fire scar on old-growth redwood. Bark a foot thick. The tree survived and kept growing. Fire is part of this forest’s operating system, not a catastrophe.
The Eel River ran clear and gravel-bedded through the valley below the redwoods, its banks forested to the waterline. That river is the redwood forest’s drainage system: the forest filters and slows the water, the river carries it. The same relationship exists between the Cedar River watershed and the forests above it that supply Seattle’s drinking water. The mechanism scales.
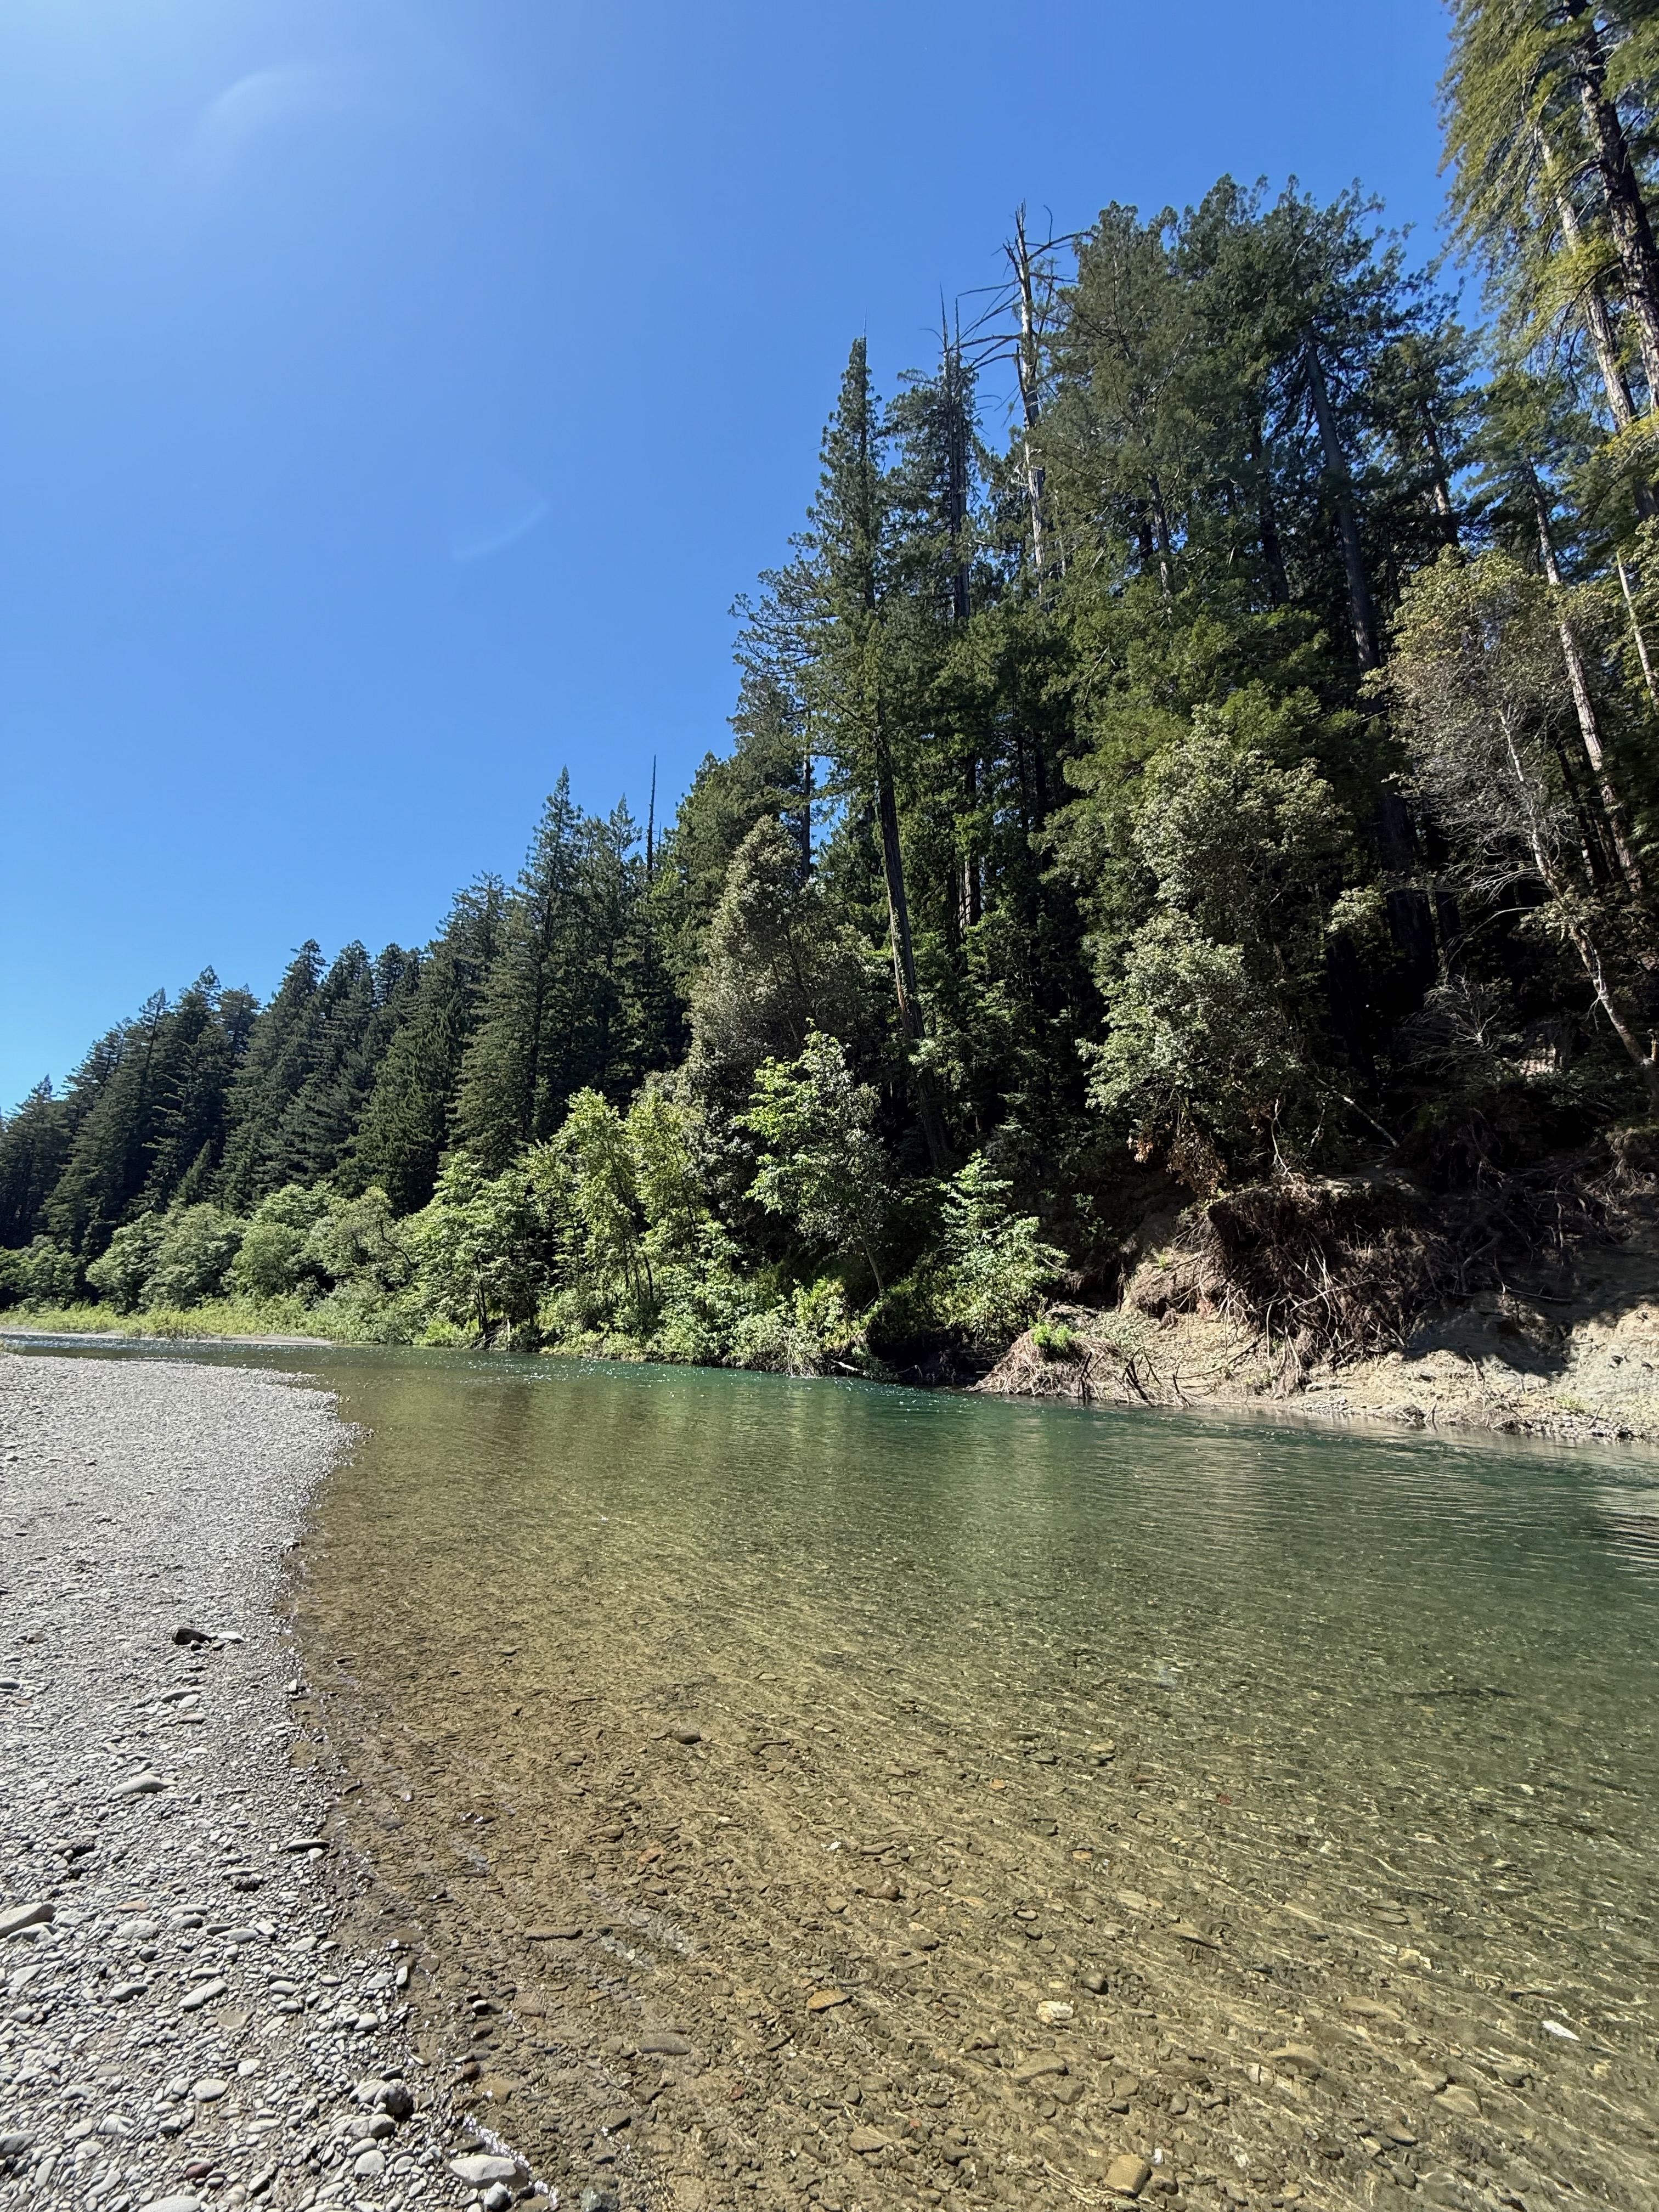 Eel River. Clear water, gravel bed, forested banks. The forest’s drainage system. Same relationship as the Cedar River and the forests that supply Seattle’s drinking water.
Observation skill: Count the layers between you and the sky. One canopy layer means young forest or managed land. Three or more layers mean complexity, maturity, and a system that has been building itself for centuries.
What This Means at Home
I drove home the next day through Northern California, up the Oregon coast, and across the Long Beach peninsula to Willapa Bay. By the time I reached the Puget Sound lowlands, everything looked different. Not because anything had changed, but because I had.
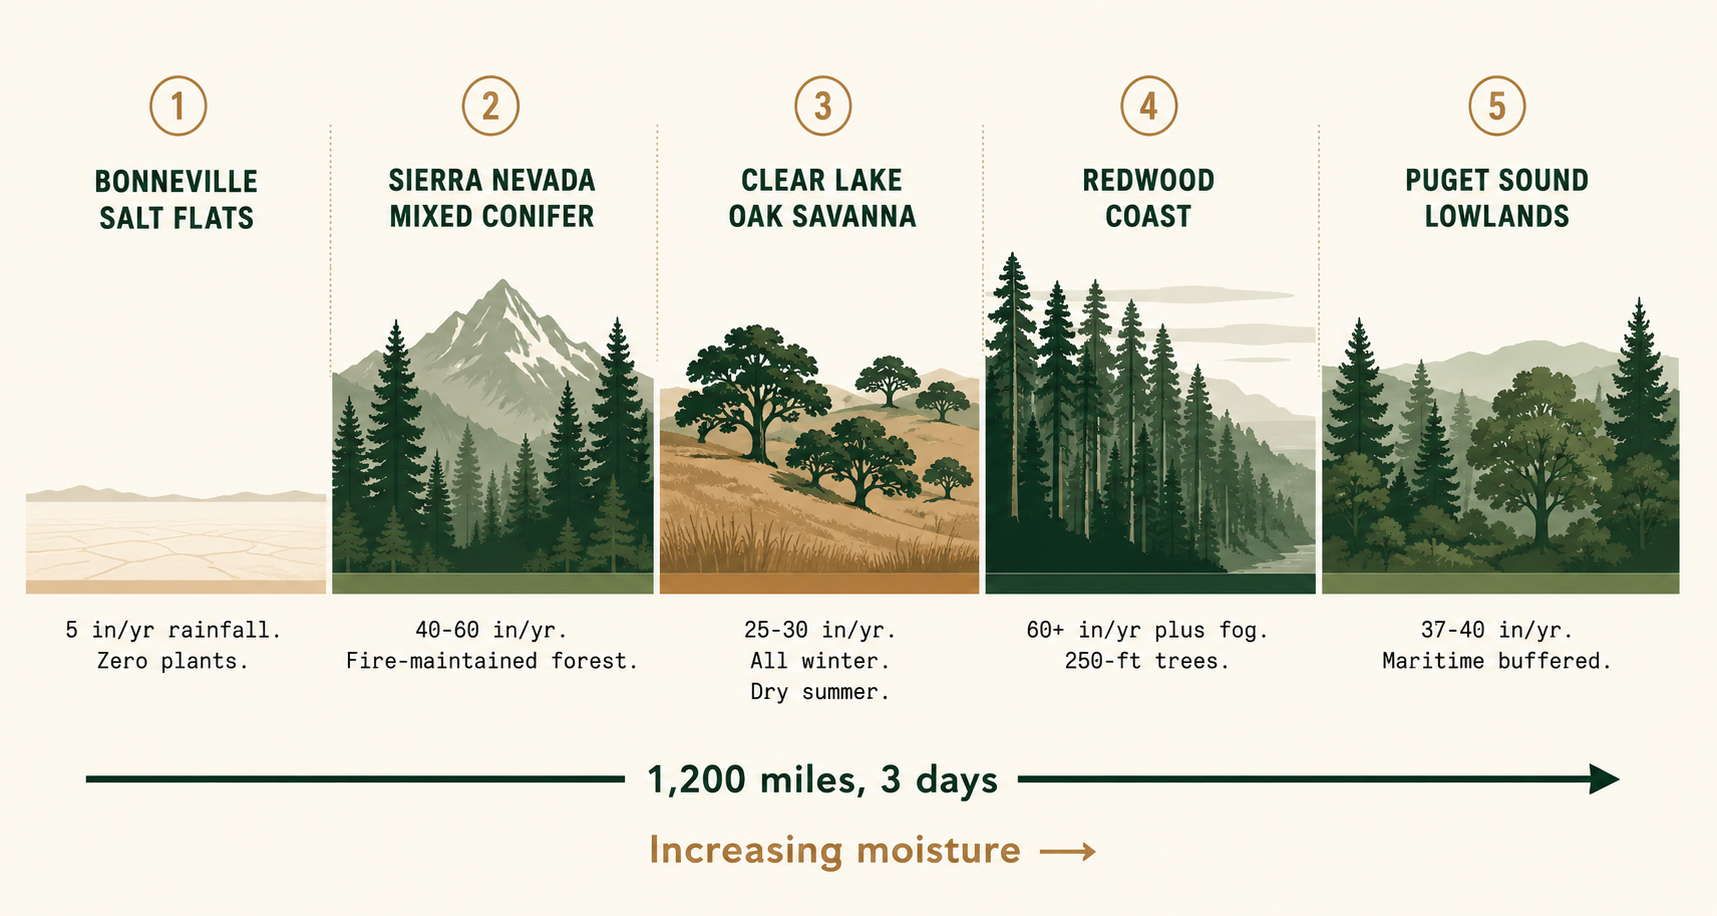 Five climate zones in three days. The Puget Sound lowlands sit on the wet end of a gradient that starts with zero plants and ends with 250-foot trees.
We live on the redwood spectrum. Western Washington shares the coast redwood’s fundamental climate recipe: maritime-moderated temperatures, reliable moisture, mild winters, cool summers. Our forests are the northern expression of the same temperate rainforest biome. The species shift (western red cedar for redwood, bigleaf maple for tanoak), but the architecture is the same. Canopy layers, nurse logs, sword fern carpets, fog-fed moisture. The redwood coast is our closest relative. The salt flats are our opposite.
Here is what I have been learning to notice since I got back, and what you can look for too. Watch when your magnolia blooms relative to your cherry. That gap is the same phenological contrast I saw on the Wasatch hillside, just compressed by maritime buffering. The gap between any two species on the same site is your climate’s fingerprint.
Notice where sword fern stops and salal starts along your side yard. That boundary marks a change in moisture, shade, or soil chemistry, the same kind of boundary I crossed between ecosystems for three days. Every species transition in your yard is telling you something about conditions.
Watch your lawn. When it goes dormant in a dry spell, it is doing exactly what the Clear Lake grass does in May: responding to the end of reliable soil moisture. The timing differs by three months. The biology is identical. Grass color is the simplest moisture gauge you have.
Look at the corner of your yard with the big tree, the volunteer fern, and the mossy stump. That corner is building the same layered complexity as the redwood forest, one rotting log at a time. Count the layers between you and the sky. More layers, more complexity, more ecological function.
None of this was new information for me. All of it was new as something I could see rather than something I had read. That is the difference this project has made: building a knowledge base about how plants work has given me eyes for the patterns, and the patterns are everywhere once you have them.
The gradient lives in your garden. A single yard in Kent has a south-facing fence (Mediterranean-dry in summer), a north-facing foundation bed (redwood-wet and shady), and everything in between. The 1,200-mile climate gradient I drove exists across 50 feet of your property.
Observation skill: The gradient lives in your garden. The south-facing fence is your Mediterranean. The north-facing foundation bed is your redwood coast. Once you start seeing the contrast, you cannot stop.
I still really enjoy coming home to the Puget Sound.
Sources
- Dawson, T.E. “Fog in the California redwood forest: ecosystem inputs and use by plants.” Oecologia, UC Berkeley
- USFS Pacific Southwest Research Station. “Fire ecology of ponderosa pine and the rebuilding of fire-resilient ponderosa pine ecosystems.” PSW-GTR-198
- NPS. “Fire & Redwoods: What Does the Future Hold for this Ancient Species?”
- Science/AAAS. “Ancient redwoods recover from fire by sprouting 1,000-year-old buds”
- Sierra Streams Institute. “Inversion Layers: What they are and how they’re tied to the slow start to winter”
- USFS FEIS. “Pinus sabiniana” species review
This is the first of two guides from a May 2026 road trip. The companion piece, The Maritime Edge, picks up on the Northern California coast and follows the marine influence north through the Oregon coast to Willapa Bay.